What Statistical Test to Use? (Test Chooser)
Answer a few questions about your data and see which statistical test fits, why, and what the alternative is.
Recent
Your last 10 settings, saved only in this browser. Nothing is uploaded.
Not sure what statistical test to use? This statistical test chooser asks about your data and tells you which test fits, with a link to the calculator that runs it. You answer up to five questions about your goal, the type of your outcome, the number of groups, whether groups are independent or paired, and whether a normal distribution is plausible. The chooser then recommends one test, gives a short reason, and names an alternative test. It runs in your browser, is free, and needs no sign-up.
The chooser covers t tests, ANOVA, chi-square, correlation and regression and their rank-based alternatives, and each recommendation links to the calculator that runs it when this site has one.
How to use the statistical test chooser
- Choose your goal: compare groups, test the relationship between two variables, check goodness of fit to a distribution, or predict an outcome from other variables.
- Select the type of your outcome variable: continuous (measured on a scale), ordinal (ranks or a rating scale), binary or categorical (yes/no, group labels), or count (0, 1, 2, … events).
- If your goal is to compare groups, select the number of groups: 1, 2, or 3 or more.
- For two or more groups, say whether the groups are independent or paired. This question is hidden when you have one group.
- For a continuous outcome, answer the normality question: yes, no, or not sure. This question is hidden for goodness of fit.
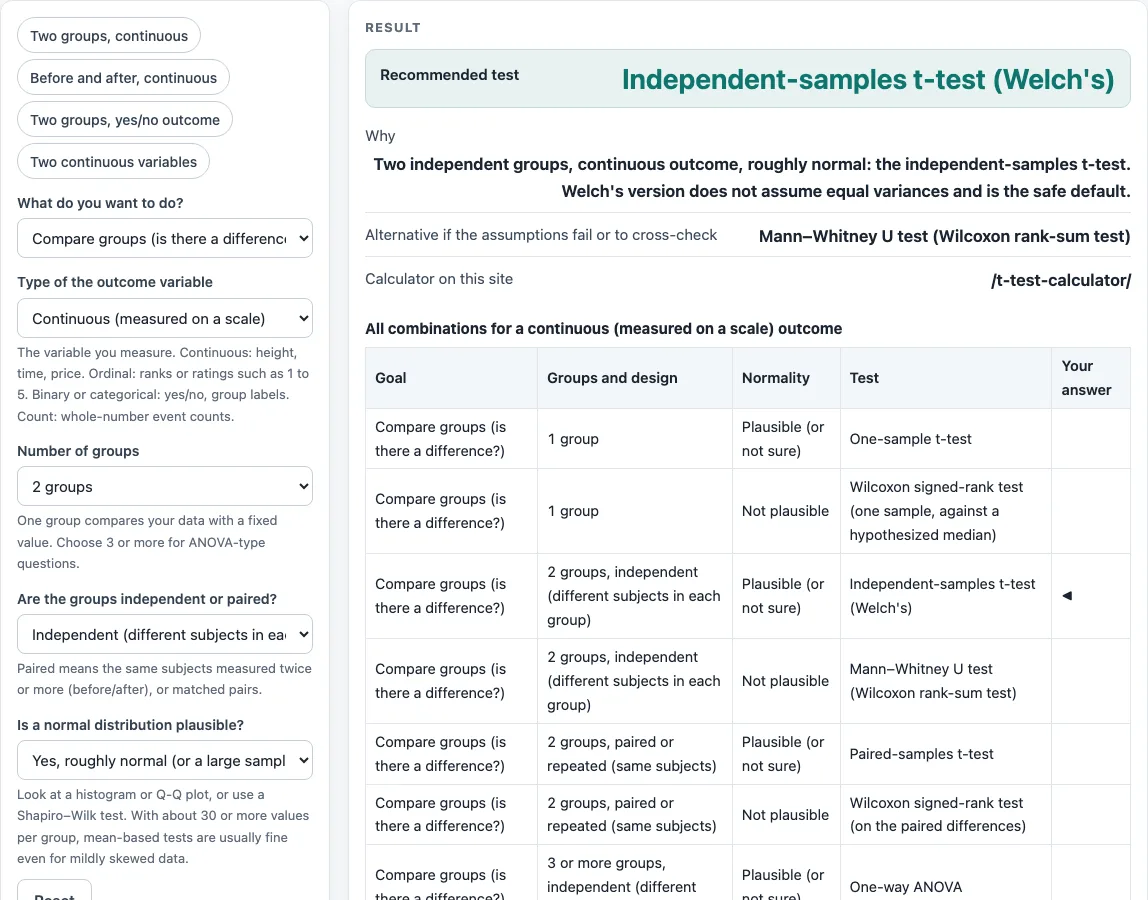
- Read the result. It shows the recommended test, a short reason, the alternative test, and a link to a calculator page when one fits.
- Check the table of every combination for your outcome type below the result; the row that matches your answers is marked.
The result updates as you change each answer, so you can compare options quickly. Use the preset buttons above the form to load typical cases, and use Reset to return to the starting example. Copy result, Copy link and Print / save as PDF work as on every calculator on this site.
What is a parametric test?
A parametric test assumes that your data follow a specific distribution, usually the normal distribution, and it estimates parameters of that distribution such as the mean and the standard deviation. Because it uses the actual measured values, it can be more powerful when its assumptions hold. Examples in this chooser include the t-test, one-way ANOVA and Pearson correlation.
What is a non-parametric test?
A non-parametric test makes few or no assumptions about the shape of the distribution. Most of these tests work with ranks, meaning they order the values and compare the ranks rather than the raw numbers. Examples include the Mann–Whitney U test, the Wilcoxon signed-rank test, the Kruskal–Wallis test and Spearman rank correlation. They are a safer choice when data are skewed or when the normal distribution is not plausible.
What is parametric data?
Parametric data is not a formal category, but the term usually means continuous data, measured on a scale, that can reasonably be assumed to follow a normal distribution. Ordinal data, such as ratings, are ranked rather than measured on equal intervals, so rank-based tests are used for them. Binary, categorical and count data each have their own test families, and the chooser handles those without asking about normality.
How does the chooser decide between parametric and non-parametric tests?
For a continuous outcome, the normality question decides the branch. If normality is plausible, the chooser recommends a parametric test and lists the non-parametric version as the alternative. If it is not, it recommends the non-parametric test and lists the parametric one as the alternative. Ordinal outcomes skip the normality question and use rank tests.
Worked examples
| Input | Result |
|---|---|
| Goal: Compare groups (is there a difference?); outcome: Continuous (measured on a scale) | Independent-samples t-test (Welch's) |
| Goal: Compare groups (is there a difference?); outcome: Continuous (measured on a scale) | Paired-samples t-test |
| Goal: Compare groups (is there a difference?); outcome: Continuous (measured on a scale) | Kruskal–Wallis test |
| Goal: Compare groups (is there a difference?); outcome: Binary or categorical (yes/no, groups) | Chi-square test of independence |
| Goal: Test the relationship between two variables; outcome: Continuous (measured on a scale) | Pearson correlation |
| Goal: Predict an outcome from other variables; outcome: Binary or categorical (yes/no, groups) | Logistic regression |
Calculated by the tool above with these values.
Frequently asked questions
Is the calculator free, and is anything I type uploaded?
Yes, the calculator is free, and there is no account or sign-up. Everything is calculated in your browser, so nothing you type is uploaded. Results may be used in any work, including commercial reports, theses and client projects, without attribution.
Can I print or share a calculation?
Yes. “Print / save as PDF” prints a one-page record with the inputs, results, calculation steps and the date. “Copy link” copies the page address, which stores every input, so the same calculation reopens later or can be sent to a colleague. “Copy result” copies the result lines with a link.
Why does the result change when I change one answer?
The decision table is a list of rules read from top to bottom, and the first matching rule wins. Changing one answer can therefore move you to a different rule. The default answers (compare groups, continuous outcome, 2 independent groups, normality plausible) give the independent-samples t-test (Welch’s), with the Mann–Whitney U test as the alternative.
What does “not sure” do for the normality question?
The chooser treats “not sure” the same as “yes”, so it recommends the parametric test first. It also shows a warning telling you to check normality and naming the alternative test. Check your data’s distribution before you rely on the parametric result.
Is the test the chooser gives me always right for my study?
The result is a starting point based on textbook decision charts. Sample size, study design and the conventions of your field also matter, so confirm the choice against them before you report results.
Related tools
- T test calculator: use it to run the independent-samples t-test once the chooser recommends it.
- Paired t test calculator: use it when your two measurements come from the same subjects.
- Z test calculator: use it when you compare a mean to a known population value and the population standard deviation is known.
- T test vs z test: read it to decide between these two tests before you calculate.
- P-value calculator: use it to convert a test statistic into a p-value.
- Critical value calculator: use it to find the cutoff a test statistic must pass for a chosen significance level.
- Confidence interval calculator: use it to estimate a plausible range for a mean or difference.
- Effect size calculator: use it to measure how large a difference or relationship is, not just whether it is significant.
- Correlation coefficient calculator: use it to measure the strength of a linear relationship between two continuous variables.