Two-Way ANOVA Calculator
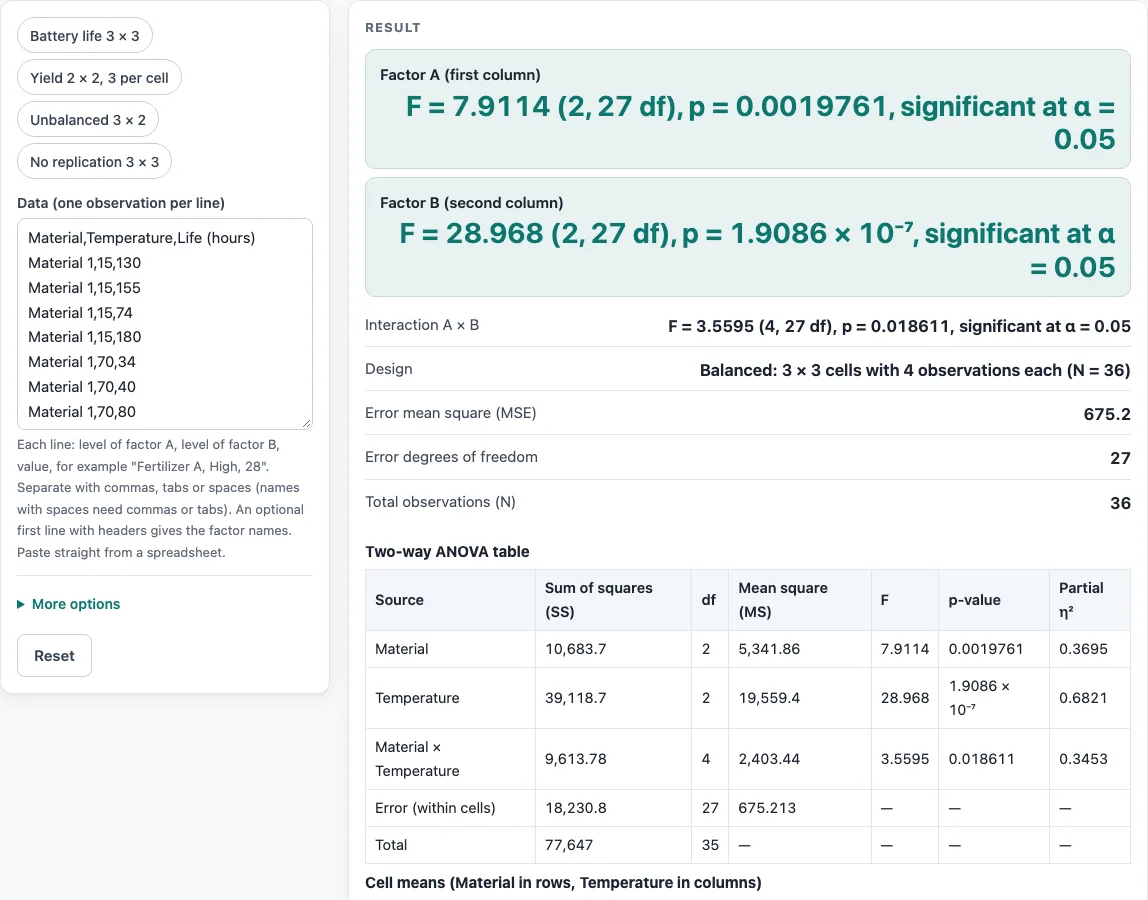
Paste one observation per line (factor A, factor B, value) to get the two-way ANOVA table with the interaction and cell means.
Recent
Your last 10 settings, saved only in this browser. Nothing is uploaded.
The two-way ANOVA calculator tests two factors and their interaction on one measured value. Enter one observation per line as a level of factor A, a level of factor B, and the value, and the F-tests, p-values and cell means update as you type. It runs in your browser, is free, and needs no sign-up. It handles balanced designs with replication, unbalanced designs with different numbers of values per cell, and designs with one value per cell. Use it when you want to know whether two factors, or their combined effect, change an outcome.
Each line of your data is one observation, which is the layout most statistics courses use.
How to use the two-way ANOVA calculator
- Start with a preset if your data looks similar. The preset buttons above the form load Montgomery’s battery life data, a 2 x 2 yield experiment, an unbalanced dose-by-sex table, or a 3 x 3 table without replication.
- Enter your data in the input box, one observation per line: factor A level, factor B level, value. For example,
Fertilizer A, High, 28. - Separate the cells with commas, tabs or spaces. If a name contains a space, use commas or tabs between cells.
- Optionally, add a first line of headers to name the factors. You can paste a column of values straight from a spreadsheet.
- Check the alpha value. It defaults to 0.05.
- Read the result for factor A, factor B and the interaction. Each line shows F, the degrees of freedom, p, and whether the result is significant at alpha.
- Read any warning shown below the result before you report anything.
- Open “How it was calculated” to see the formula, the values substituted and the answer.
- Check the cell means table, with factor A in rows, factor B in columns, and the marginal means labelled All.
- Use “Copy result” to copy the result lines with a link, or “Copy link” to copy the page address, which stores your inputs.
- Click “Print / save as PDF” for a one-page record of inputs, results, steps and the date. Click “Reset” to return to the starting example.
What is two way ANOVA?
Two-way ANOVA (analysis of variance) tests whether two factors affect a measured value, and whether they interact. It splits the total variation in the data into parts for factor A, factor B, their interaction, and random error. Each part is compared with the error variation using an F-test.
How does the two-way ANOVA table work?
Each row of the table has a sum of squares (SS), degrees of freedom (df), a mean square (SS divided by df), and an F value. F is the mean square for the effect divided by the error mean square. The p-value comes from the F distribution with the effect’s df and the error df. Partial eta squared equals SS effect divided by (SS effect + SSE), and it shows the share of variation each effect accounts for once the other effects are removed.
The starting example is Montgomery’s battery-life experiment (three plate materials × three temperatures, four batteries per cell). The calculator reproduces the textbook sums of squares: material 10,683.72, temperature 39,118.72, interaction 9,613.78 and error 18,230.75 on 27 degrees of freedom.
What does an interaction mean in two-way ANOVA?
An interaction means the effect of one factor depends on the level of the other. If the interaction is significant, read the main effects with care, because the effect of factor A is not the same at every level of factor B. Plot or compare the cell means to see the pattern.
How are balanced and unbalanced designs handled?
In a balanced design, every cell has the same number of values, and the textbook formulas apply. The calculator shows the full table with the A, B, interaction, error and total rows. In an unbalanced design, the calculator uses Type II sums of squares, so each main effect is adjusted for the other factor. The Total row is hidden because Type II sums do not add up, and a table of cell sizes is shown. Some statistics packages default to Type III sums instead, which can give different F values for the main effects.
What happens without replication?
If each cell has exactly one value, the interaction cannot be separated from the error. The calculator then fits the additive model, A + B, and uses the residual with (a - 1)(b - 1) degrees of freedom as the error term. No interaction row appears, and the results assume there is no interaction.
Worked examples
| Input | Result |
|---|---|
| 3 × 3 design, N = 36, with interaction | Material: F = 7.9114 (2, 27 df), p = 0.0019761, significant at α = 0.05; Temperature: F = 28.968 (2, 27 df), p = 1.9086 × 10⁻⁷, significant at α = 0.05; Material × Temperature: F = 3.5595 (4, 27 df), p = 0.018611, significant at α = 0.05 |
| 2 × 2 design, N = 12, with interaction | Fertilizer: F = 16.69 (1, 8 df), p = 0.0035083, significant at α = 0.05; Water: F = 60.828 (1, 8 df), p = 5.2412 × 10⁻⁵, significant at α = 0.05; Fertilizer × Water: F = 1.2414 (1, 8 df), p = 0.29756, not significant at α = 0.05 |
| 3 × 2 design, N = 18, with interaction | Dose: F = 2.8327 (2, 12 df), p = 0.098252, not significant at α = 0.05; Sex: F = 64.368 (1, 12 df), p = 3.651 × 10⁻⁶, significant at α = 0.05; Dose × Sex: F = 13.231 (2, 12 df), p = 9.2242 × 10⁻⁴, significant at α = 0.05 |
| 3 × 3 design, N = 9, additive model | Operator: F = 23.286 (2, 4 df), p = 0.0062562, significant at α = 0.05; Machine: F = 58.429 (2, 4 df), p = 0.0010954, significant at α = 0.05 |
Calculated by the tool above with these values.
Frequently asked questions
Is the calculator free, and is anything I type uploaded?
Yes, the calculator is free and needs no account or sign-up. Everything is calculated in your browser, and nothing you type is uploaded.
Can I print or share a calculation?
Yes. “Print / save as PDF” produces a one-page record with the inputs, results, calculation steps and date. “Copy link” copies a page address that stores every input, so the same calculation reopens later or can be sent to a colleague.
Can I use the results in a report or thesis?
Yes. Results may be used in any work, including commercial reports, theses and client projects, without attribution. Check that the method’s assumptions fit your data before you report the results.
What does “no replication” mean for my data?
It means you have exactly one value in every combination of the two factors. The calculator then assumes no interaction and uses the additive model for the error term.
Why are the F values different from another program’s?
For unbalanced data, the calculator uses Type II sums of squares. Programs that default to Type III sums can report different F values for the main effects, so check which type your software uses.
Related tools
- Chi-square test calculator: use it to test whether counts in a contingency table are independent.
- Chi-square goodness of fit calculator: use it to test whether observed counts match an expected distribution.
- One-way ANOVA calculator: use it to compare means across one factor only.
- Odds ratio calculator: use it to compare the odds of an outcome between two groups.
- P-value calculator: use it to convert a test statistic into a p-value.
- Critical value calculator: use it to find the cutoff a test statistic must exceed at a chosen alpha.
- Which statistical test to use: use it to choose the right test before you run the calculation.