T Test vs Z Test
Enter a mean, SD and sample size to run a t test and a z test side by side and see which one applies to your data.
Recent
Your last 10 settings, saved only in this browser. Nothing is uploaded.
How to use the T test vs Z test calculator
- Type the sample mean x̄ and the hypothesized mean μ₀.
- Type the standard deviation. Leave the checkbox unticked if this is a sample SD. Tick it only if the value is the known population SD σ.
- Type the sample size n. It must be a whole number of at least 2.
- Choose the tail: two-tailed, right-tailed or left-tailed.
- Set α. It defaults to 0.05, and you can also type 5 %.
- Read the two large results: the recommended test’s name and its p-value.
- Check the verdict at α for that test, then compare the two tests in the side-by-side table.
- Open “How it was calculated” under the result to see the formula, the values substituted and the answer.
The result updates as you type. The preset buttons above the form load typical cases, such as a case where the two tests disagree. Reset restores the starting example. Printing, copying and sharing are covered below.
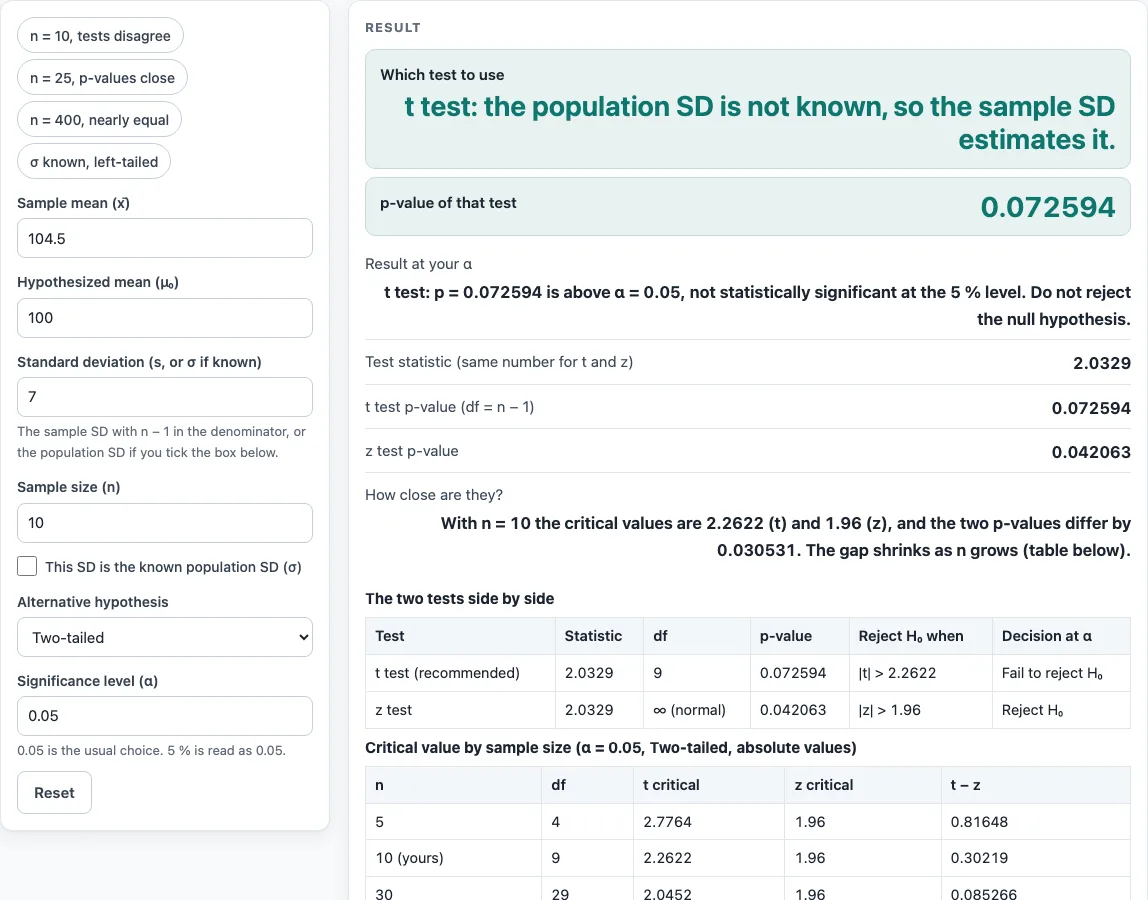
Example: x̄ = 104.5, μ₀ = 100, SD = 7 and n = 10 (the starting values) give the same statistic, 2.0329, for both tests, but the t test does not reject at α = 0.05 (p = 0.072594) while the z test does (p = 0.042063). Tick the σ box only if 7 is a known population value, not one measured from these ten observations.
T test vs z test: what is the difference?
The two tests share one statistic: t = (x̄ − μ₀)/(SD/√n). The t test compares it with a t distribution that has n − 1 degrees of freedom. The z test compares the same number with the standard normal, which is equivalent to treating the degrees of freedom as infinite. The t distribution has heavier tails, so its p-value is never smaller than the z p-value for the same statistic. Using z with a sample SD therefore makes a result look more significant than it is.
When to use a t test vs a z test
Use the z test when the population standard deviation σ is known from outside the sample — for example from a long-running process or a published norm — and for large-sample tests of proportions. Use the t test whenever the standard deviation comes from the same sample, which is nearly always the case in practice. The gap is largest for small samples. With the starting example (x̄ = 104.5, μ₀ = 100, SD = 7, n = 10, two-tailed), the statistic is 2.0329. The t test gives p = 0.072594 and fails to reject at α = 0.05, because the critical value is 2.2622. The z test gives p = 0.042063 and rejects, because its critical value is 1.96. As n grows, the t critical value falls toward 1.96, and the two tests agree.
Does sample size change the answer?
Yes, through the degrees of freedom. The table under the result shows the two-tailed 5 % critical values for t at n = 5, 10, 30, 100 and 1000 next to z = 1.96: the difference is large at n = 5 and almost gone at n = 1000. That is why older textbooks said a z test is fine above n = 30; with software there is no reason not to use the t test whenever σ is estimated from the sample.
Worked examples
| Input | Result |
|---|---|
| x̄ = 104.5, μ₀ = 100, SD = 7, n = 10, Two-tailed | statistic = 2.033, t test p = 0.072594, z test p = 0.042063, use the t test |
| x̄ = 52.3, μ₀ = 50, SD = 6.2, n = 25, Two-tailed | statistic = 1.855, t test p = 0.075946, z test p = 0.063619, use the t test |
| x̄ = 100.8, μ₀ = 100, SD = 4, n = 400, Two-tailed | statistic = 4, t test p = 7.5493 × 10⁻⁵, z test p = 6.3342 × 10⁻⁵, use the t test |
| x̄ = 98.4, μ₀ = 100, SD = 5, n = 30, Left-tailed | statistic = -1.753, t test p = 0.04511, z test p = 0.039826, use the z test |
Calculated by the tool above with these values.
Frequently asked questions
Is the calculator free, and is anything I type uploaded?
Yes, the calculator is free. Everything is calculated in your browser, so nothing you type is uploaded, and there is no account or sign-up. Results may be used in any work, including commercial reports, theses and client projects, without attribution. The page reminds you to check that the method’s assumptions fit your data before you report a result.
Can I print or share a calculation?
Yes. “Print / save as PDF” produces a one-page record with your inputs, the results, the calculation steps and the date. “Copy result” copies the result lines together with a link. “Copy link” copies the page address, which stores every input in the ?s= part of the URL, so the same calculation reopens later or can be sent to a colleague.
Why is the t p-value always larger than the z p-value for the same numbers?
The t distribution has heavier tails than the standard normal, so a given test statistic leaves more probability beyond it. The t p-value is therefore never smaller than the z p-value for the same statistic.
When should I use the z test instead of the t test?
Use the z test only when the population standard deviation σ is known. If you only have a sample standard deviation, use the t test, because the sample SD is an estimate and the t test allows for that uncertainty.
Why do the t and z critical values get closer as the sample size grows?
The t distribution’s degrees of freedom are n − 1, so as n increases the t distribution approaches the standard normal. In the calculator’s table, the gap t − z shrinks at n = 5, 10, 30, 100 and 1000.
What does the warning about the p-value being within 2 % of α mean?
It means the decision is close. A small change in the data or in α could change the verdict, so report the p-value along with the decision rather than the decision alone.
What does the warning about the sample mean pointing the wrong way mean?
For a one-sided alternative, the warning appears when x̄ lies on the opposite side of μ₀ from the direction you chose. In that case the p-value for that tail is large, and you should check that you picked the right tail.
Related tools
- T test calculator: use it to run a one-sample t test on its own.
- Paired t test calculator: use it when each observation is paired with another, such as before and after measurements.
- Z test calculator: use it when the population standard deviation σ is known.
- P-value calculator: use it to convert a test statistic into a p-value.
- Critical value calculator: use it to find the cutoff for a chosen α and tail.
- Confidence interval calculator: use it to see the range of plausible values for the mean.
- Which statistical test to use: use it when you are not sure which test fits your question.
- Effect size calculator: use it to measure how large a difference is, not just whether it is significant.