T Test Calculator
Paste one or two samples (or type means, SDs and sizes) to get the t statistic, p-value, confidence interval and effect size.
Recent
Your last 10 settings, saved only in this browser. Nothing is uploaded.
How to use the t test calculator
- Pick a preset above the form to load a typical case, or start from the example that opens on the page.
- Choose the test: one-sample, two-sample Welch or two-sample pooled.
- Enter your data. Paste raw values into each sample box. Spaces, commas, semicolons, tabs and new lines all separate values, so a copied spreadsheet column works. Alternatively, enter summary statistics: the mean, sample standard deviation and sample size for each group.
- For one sample, enter the hypothesized mean μ₀. For two samples, leave the hypothesized difference μ₁ − μ₂ at 0, or change it under More options.
- Select the alternative hypothesis: two-tailed, right-tailed (greater) or left-tailed (less).
- Set α. It defaults to 0.05, and you can also type 5 %.
- Read the results. They update as you type. Check the decision, which says whether you reject or do not reject the null hypothesis at your α, and read any warning that appears.
- Open “How it was calculated” under the result to see the formula, the substituted values and the answer.
Use Copy result to copy the result lines with a link, or Copy link to copy the page address, which stores all your inputs so the calculation reopens later or can be sent to a colleague. Print / save as PDF produces a one-page record of inputs, results, steps and the date. Reset restores the starting example.
What is t test in statistics?
A t test is a hypothesis test that checks whether a sample mean, or the difference between two sample means, is far enough from a hypothesized value that chance alone is an unlikely explanation. It is used when the population standard deviation is unknown and has to be estimated from the sample, so the result is judged against a t distribution. The null hypothesis is usually “no difference” or “the mean equals μ₀”, and the test asks how surprising the data would be if that were true.
The versions differ in how they estimate spread. The pooled test assumes both groups share one variance, so it combines the two sample variances and uses df = n₁ + n₂ − 2. The Welch test does not make that assumption. Its standard error is √(s₁²/n₁ + s₂²/n₂), and its degrees of freedom are usually not a whole number. The one-sample test uses SE = s/√n with df = n − 1.
What is the t statistic?
The t statistic is the distance between your estimate and the hypothesized value, measured in standard errors. For one sample it is t = (x̄ − μ₀)/SE. For two samples it is the observed difference minus the hypothesized difference, divided by the standard error of the chosen test. A larger absolute t means the data sit further from the null value. A test statistic calculator like this one finds that value and then converts it, together with the degrees of freedom, into a p-value for the alternative you selected.
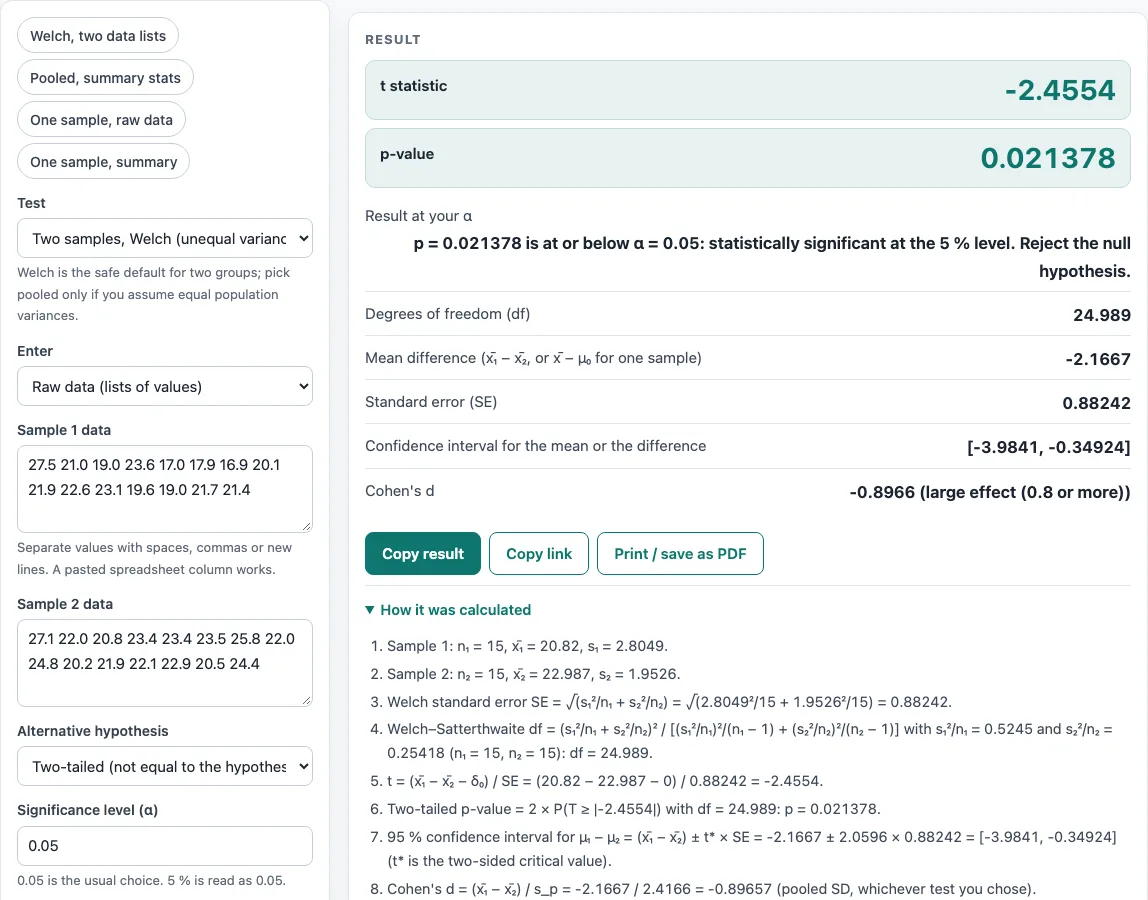
With the example that opens on the page (two groups of 15 values, Welch test), t = −2.4554 on 24.989 degrees of freedom and the two-tailed p-value is 0.021378, so the difference is significant at α = 0.05. The confidence interval is always two-sided at 1 − α, even when the test is one-tailed. A p-value below α leads to rejecting the null hypothesis, which is a statement about the data at that level, not proof that the effect exists.
Worked examples
| Input | Result |
|---|---|
| Two samples, Welch (unequal variances), n₁ = 15, n₂ = 15, Two-tailed (not equal to the hypothesized value) | t = -2.455, df = 24.99, p = 0.021378, significant at α = 0.05 |
| Two samples, pooled (equal variances), n₁ = 20, n₂ = 22, Right-tailed (greater than the hypothesized value) | t = 1.606, df = 40, p = 0.058057, not significant at α = 0.05 |
| One sample, n = 25, Right-tailed (greater than the hypothesized value) | t = 1.855, df = 24, p = 0.037973, significant at α = 0.05 |
| One sample, n = 10, Two-tailed (not equal to the hypothesized value) | t = 1.765, df = 9, p = 0.11137, not significant at α = 0.05 |
| Two samples, Welch (unequal variances), n₁ = 30, n₂ = 28, Two-tailed (not equal to the hypothesized value) | t = 1.527, df = 51.5, p = 0.13284, not significant at α = 0.01 |
Calculated by the tool above with these values.
Frequently asked questions
Is the t test calculator free, and is anything I type uploaded?
Yes, it is free and needs no account or sign-up. All calculations run in your browser, and nothing you type is uploaded. Results may be used in any work, including commercial reports, theses and client projects, without attribution.
Can I print or share a calculation?
Yes. Print / save as PDF creates a one-page record with the inputs, results, calculation steps and date. Copy link copies the page address, which stores every input, so the same calculation can be reopened later or sent to a colleague.
What is one sample t test?
A one-sample t test compares the mean of a single group with a hypothesized value, μ₀. You can enter the raw values or the mean, standard deviation and sample size. The test uses SE = s/√n and n − 1 degrees of freedom.
What is t test in research?
In research, a t test checks whether a measured group mean differs from a reference value, or whether two group means differ. Researchers usually report the t statistic, degrees of freedom and p-value. Check that the test’s assumptions fit your data before you report the result.
What is test statistic?
A test statistic is a single number calculated from sample data that measures how far the data are from the null hypothesis. A t test uses the t statistic as its test statistic. The p-value and decision come from comparing that number with its reference distribution.
What is at test?
“At test” is usually a typing error for t test, a hypothesis test built on the t distribution. Enter your data above to run one.
Related tools
- Paired t test calculator: use it when each value in one group is matched with a value in the other, such as before and after measurements on the same people.
- Z test calculator: use it when the population standard deviation is known or the sample is large.
- T test vs z test: read this to decide which of the two tests fits your data.
- P-value calculator: use it to convert a test statistic into a p-value directly.
- Confidence interval calculator: use it when you need an interval for a mean or a difference on its own.
- Effect size calculator: use it to measure how large a difference is, separately from whether it is significant.
- Which statistical test to use: use it when you are not yet sure which test matches your question.