T Table (Student t Critical Values)
Enter your degrees of freedom and significance level to get the t critical value, with the full t table for df 1 to 120 and ∞ underneath.
Recent
Your last 10 settings, saved only in this browser. Nothing is uploaded.
This t table gives the Student t critical value for any degrees of freedom and significance level. Type the df and α, pick one-tailed or two-tailed, and you get the exact critical value, the confidence level it matches, and the value a printed t table would show for the same df. Below the calculator is the full t table for df 1 to 30, 40, 50, 60, 80, 100, 120 and ∞, with one-tailed and two-tailed α in the column headings.
The t critical value is the cut-off your t statistic must pass to reject the null hypothesis at level α, and the multiplier used for a confidence interval for a mean. It works for a t test table lookup, a t critical value for a confidence interval, and any df that a printed table leaves out. It runs in your browser, is free, and needs no account or sign-up.
How to use the t table
- Enter the degrees of freedom (df). For a one-sample or paired t test df = n − 1; for a pooled two-sample t test df = n₁ + n₂ − 2.
- Enter the significance level α as 0.05 or as 5 %.
- Choose Two-tailed when the alternative hypothesis is “different from”, or One-tailed when it is “greater than” or “less than”. For two-tailed, α is the total over both tails.
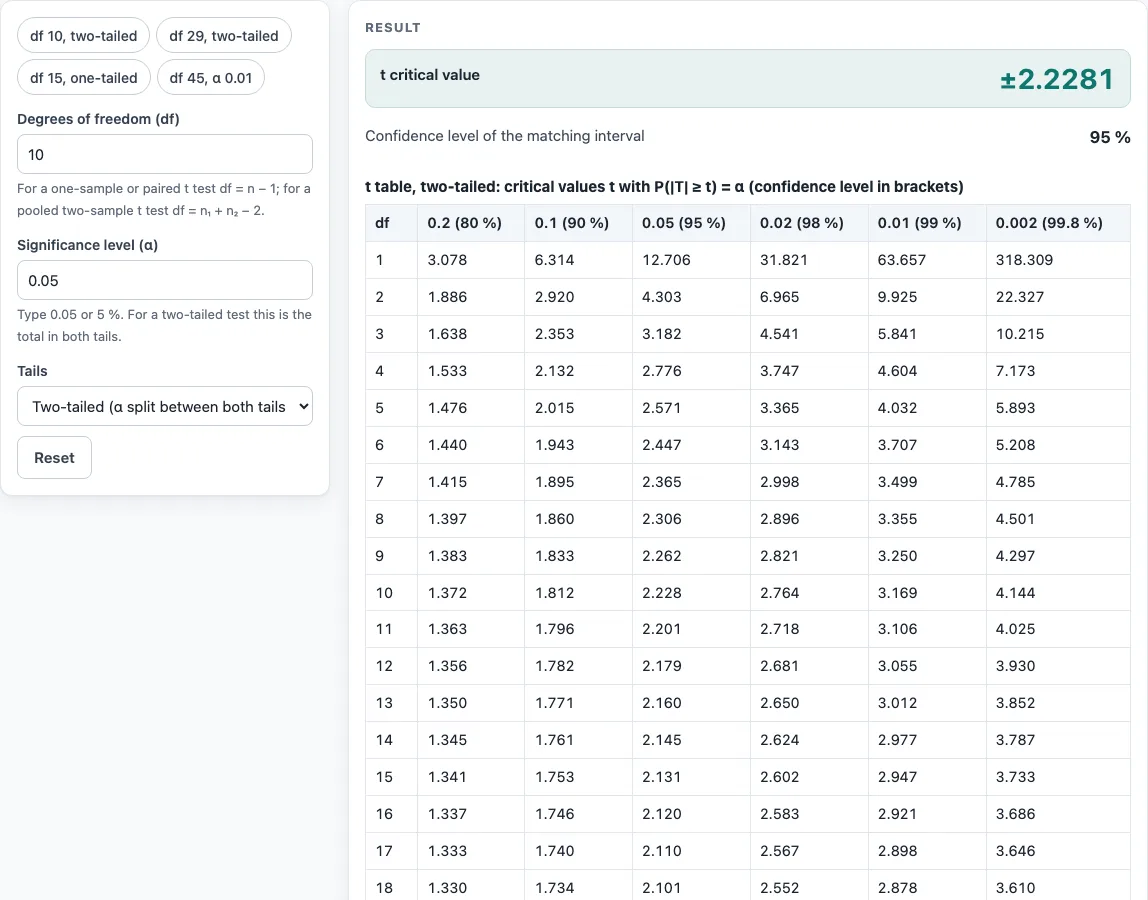
- Read the large figure, the t critical value. A two-tailed result is shown as ±, for example ±2.2281 for df 10 and α 0.05.
- Check the other lines, which appear below the critical value: the confidence level of the matching interval (two-tailed only) and, when your df is not a row of the printed table, the value you would read from the row below it.
- The table under the result shows the whole t table for the tail you chose, and the fixed copy further down can be printed or copied.
Preset buttons load typical cases, such as df 10 two-tailed, df 29 two-tailed, df 15 one-tailed and df 45 at α 0.01. Reset returns to the starting example. Copy result copies the result lines with a link, Copy link stores every input in the page address, and Print / save as PDF produces a one-page record with the inputs, results, steps and date.
How to read a t table
A t table lists the value of t that leaves a given probability in the upper tail, for each number of degrees of freedom. Rows are df, columns are α.
- Go down the df column to your degrees of freedom. If your df is not listed, use the next smaller df, which gives a slightly larger, safer critical value.
- Go across to the column for your α. Use the one-tailed row of headings for a one-tailed test and the two-tailed row for a two-tailed test. The same column serves both: one-tailed 0.025 is the same column as two-tailed 0.05.
- The number where row and column meet is the critical value. For df 10, one-tailed 0.025 (two-tailed 0.05) gives 2.228.
- Compare it with your t statistic. In a two-tailed test, reject H₀ when |t| is larger than the critical value. In a one-tailed test, reject H₀ when t is beyond the critical value in the direction of H₁; for a left-tailed test, use the negative of the table value.
Example: a one-sample t test on 15 observations has df = 14. The two-tailed critical value at α = 0.05 is 2.145. A t statistic of 2.3 is larger, so H₀ is rejected at the 5 % level. A t statistic of 1.9 is not.
One-tailed or two-tailed t table
A two-tailed test puts half of α in each tail, so the critical value for two-tailed α = 0.05 is the one-tailed value for 0.025. For df 29, a two-tailed test at 0.05 uses 2.045 and a one-tailed test at 0.05 uses 1.699. Pick the tail from your hypothesis before you look at the data.
T table for confidence intervals
For a confidence interval for a mean, use the two-tailed column for α = 1 − confidence level. A 95 % interval from 25 observations has df = 24, so the multiplier is 2.064: the interval is the mean ± 2.064 × s ÷ √25. For large df the t value approaches the ∞ row, which is the standard normal value: 1.960 for a 95 % two-sided interval and 1.645 for a one-tailed test at 0.05.
The t table (df 1 to 120 and ∞)
Upper-tail critical values t with P(T ≥ t) = α. The first row of headings is the one-tailed α and the second the two-tailed α. Calculated with the same distribution code as the calculator and checked against SciPy.
| df | 0.1 | 0.05 | 0.025 | 0.01 | 0.005 | 0.001 |
|---|---|---|---|---|---|---|
| two-tailed α | 0.2 | 0.1 | 0.05 | 0.02 | 0.01 | 0.002 |
| 1 | 3.078 | 6.314 | 12.706 | 31.821 | 63.657 | 318.309 |
| 2 | 1.886 | 2.920 | 4.303 | 6.965 | 9.925 | 22.327 |
| 3 | 1.638 | 2.353 | 3.182 | 4.541 | 5.841 | 10.215 |
| 4 | 1.533 | 2.132 | 2.776 | 3.747 | 4.604 | 7.173 |
| 5 | 1.476 | 2.015 | 2.571 | 3.365 | 4.032 | 5.893 |
| 6 | 1.440 | 1.943 | 2.447 | 3.143 | 3.707 | 5.208 |
| 7 | 1.415 | 1.895 | 2.365 | 2.998 | 3.499 | 4.785 |
| 8 | 1.397 | 1.860 | 2.306 | 2.896 | 3.355 | 4.501 |
| 9 | 1.383 | 1.833 | 2.262 | 2.821 | 3.250 | 4.297 |
| 10 | 1.372 | 1.812 | 2.228 | 2.764 | 3.169 | 4.144 |
| 11 | 1.363 | 1.796 | 2.201 | 2.718 | 3.106 | 4.025 |
| 12 | 1.356 | 1.782 | 2.179 | 2.681 | 3.055 | 3.930 |
| 13 | 1.350 | 1.771 | 2.160 | 2.650 | 3.012 | 3.852 |
| 14 | 1.345 | 1.761 | 2.145 | 2.624 | 2.977 | 3.787 |
| 15 | 1.341 | 1.753 | 2.131 | 2.602 | 2.947 | 3.733 |
| 16 | 1.337 | 1.746 | 2.120 | 2.583 | 2.921 | 3.686 |
| 17 | 1.333 | 1.740 | 2.110 | 2.567 | 2.898 | 3.646 |
| 18 | 1.330 | 1.734 | 2.101 | 2.552 | 2.878 | 3.610 |
| 19 | 1.328 | 1.729 | 2.093 | 2.539 | 2.861 | 3.579 |
| 20 | 1.325 | 1.725 | 2.086 | 2.528 | 2.845 | 3.552 |
| 21 | 1.323 | 1.721 | 2.080 | 2.518 | 2.831 | 3.527 |
| 22 | 1.321 | 1.717 | 2.074 | 2.508 | 2.819 | 3.505 |
| 23 | 1.319 | 1.714 | 2.069 | 2.500 | 2.807 | 3.485 |
| 24 | 1.318 | 1.711 | 2.064 | 2.492 | 2.797 | 3.467 |
| 25 | 1.316 | 1.708 | 2.060 | 2.485 | 2.787 | 3.450 |
| 26 | 1.315 | 1.706 | 2.056 | 2.479 | 2.779 | 3.435 |
| 27 | 1.314 | 1.703 | 2.052 | 2.473 | 2.771 | 3.421 |
| 28 | 1.313 | 1.701 | 2.048 | 2.467 | 2.763 | 3.408 |
| 29 | 1.311 | 1.699 | 2.045 | 2.462 | 2.756 | 3.396 |
| 30 | 1.310 | 1.697 | 2.042 | 2.457 | 2.750 | 3.385 |
| 40 | 1.303 | 1.684 | 2.021 | 2.423 | 2.704 | 3.307 |
| 50 | 1.299 | 1.676 | 2.009 | 2.403 | 2.678 | 3.261 |
| 60 | 1.296 | 1.671 | 2.000 | 2.390 | 2.660 | 3.232 |
| 80 | 1.292 | 1.664 | 1.990 | 2.374 | 2.639 | 3.195 |
| 100 | 1.290 | 1.660 | 1.984 | 2.364 | 2.626 | 3.174 |
| 120 | 1.289 | 1.658 | 1.980 | 2.358 | 2.617 | 3.160 |
| ∞ | 1.282 | 1.645 | 1.960 | 2.326 | 2.576 | 3.090 |
Worked examples
| Input | Result |
|---|---|
| df 10, α 0.05, Two-tailed (α split between both tails) | t = ±2.2281 |
| df 5, α 0.05, One-tailed (all of α in one tail) | t = 2.015 |
| df 29, α 0.01, Two-tailed (α split between both tails) | t = ±2.7564 |
| df 45, α 0.05, Two-tailed (α split between both tails) | t = ±2.0141 |
| df 15, α 0.05, One-tailed (all of α in one tail) | t = 1.7531 |
Calculated by the tool above with these values.
Frequently asked questions
What is a t table?
A t table lists critical values of the Student t distribution for different degrees of freedom and significance levels. You compare your t statistic with the value in the table to decide whether a result is statistically significant.
What is the t critical value for df 10 at 0.05?
For a two-tailed test at α = 0.05 it is 2.228. For a one-tailed test at α = 0.05 it is 1.812.
What if my df is not in the table?
Use the exact value from the calculator, or in an exam use the next smaller df in the table. For df 45 the exact two-tailed 0.05 value is 2.014; the table row for df 40 gives 2.021, which is a little larger and so on the safe side.
What is the t table value for a very large df?
The ∞ row equals the standard normal quantile: 1.282 at one-tailed 0.10, 1.645 at 0.05, 1.960 at 0.025, 2.326 at 0.01, 2.576 at 0.005 and 3.090 at 0.001.
How is the t table different from a z table?
A z table gives probabilities for the standard normal distribution. A t table gives critical values of the t distribution and depends on df, because t has heavier tails when the sample is small. As df grows, the t values fall towards the z values.
Is the calculator free, and is anything I type uploaded?
Yes, it is free. Everything is calculated in your browser, so nothing you type is uploaded, and there is no account or sign-up.
Sources: NIST/SEMATECH e-Handbook of Statistical Methods, 1.3.6.7.2 Critical Values of the Student’s t Distribution.
Related tools
- Critical value calculator for z, chi-square and F critical values as well as t.
- T test calculator to compute the t statistic from your data.
- P-value calculator to turn a t statistic and df into a p-value.
- Confidence interval calculator for the interval itself.
- T test vs z test when you are not sure which table applies.
- Which statistical test to choose a test from your data.