Stem and Leaf Plot Generator
Paste a list of numbers to get a stem-and-leaf plot with its key, with options for the leaf unit, split stems and rounding.
Recent
Your last 10 settings, saved only in this browser. Nothing is uploaded.
How to use the Stem and leaf plot generator
- Paste your numbers into the Numbers box. Separate them with commas, spaces or new lines. A column copied from a spreadsheet also works. You can enter up to 2,000 values.
- Open More options.
- Set Leaf unit. Keep Automatic to let the tool choose, or pick a fixed value such as 1, 10 or 0.1.
- Set Lines per stem. Choose One line per stem, or Two lines per stem if your plot has only a few stems.
- Set Digits beyond the leaf. Keep the default, Cut them off (truncate), or choose Round to the nearest leaf.
- Read the plot. Each line shows a stem, a vertical bar, and the leaves in increasing order. The key below the plot tells you what one stem and leaf pair means.
- Check the result rows: Values (n), Lines in the plot, Leaf unit used, Key, Smallest value, Largest value and Median. The steps list states the leaf unit and the rule that was applied.
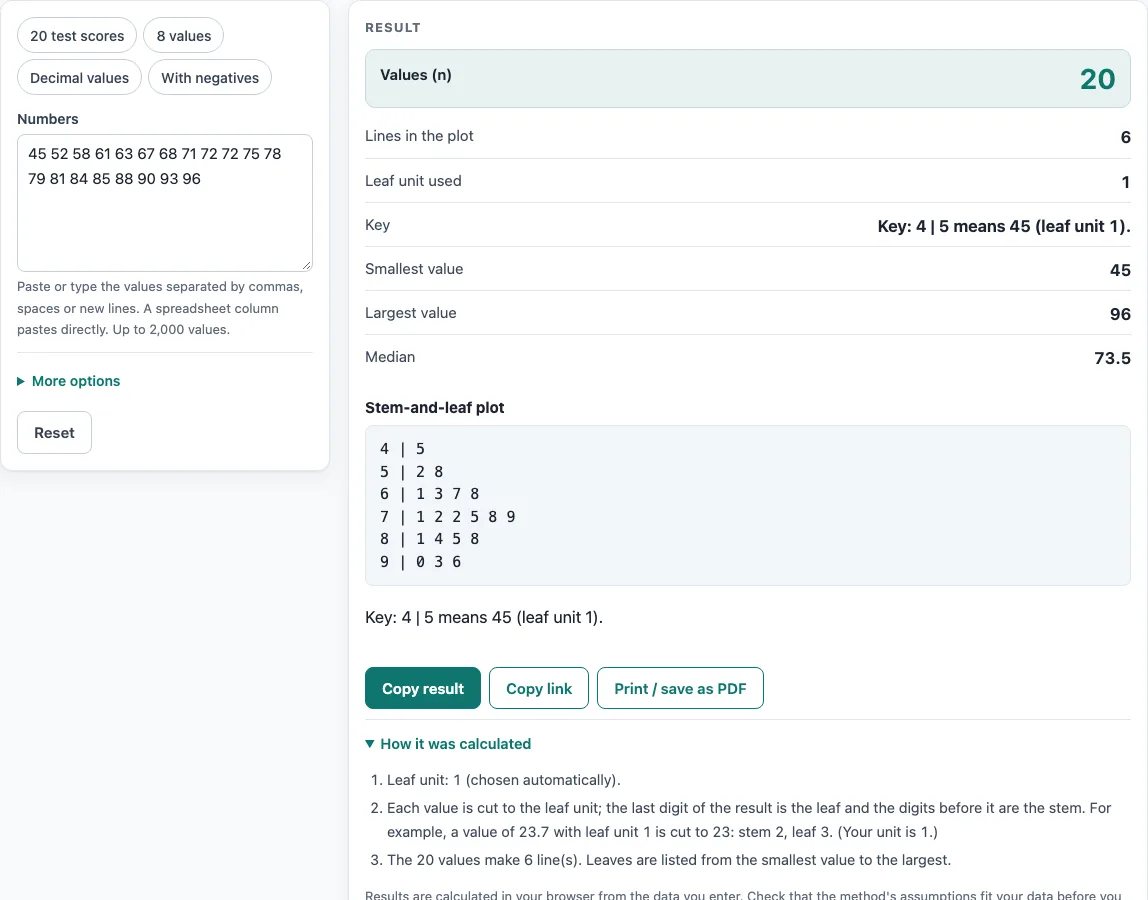
The page loads with a set of 20 test scores so you can see a finished plot straight away. The presets include 8 values, decimal values and negative values. Use Copy link to save your inputs in the address, or Print / save as PDF to keep the result and the plot.
How do I make a stem and leaf plot?
To make one, split each value into a stem and a leaf, group the values that share a stem, and list the leaves in order on that stem’s line. The split depends on the leaf unit, which decides which digit becomes the leaf. Each value is first cut to that unit, then its last digit is the leaf and the digits before it are the stem.
For example, with leaf unit 1, the value 23 has stem 2 and leaf 3. Every value with a stem of 2 goes on the line for 2, so 21, 22, 22 and 28 would all sit on the 2 line as leaves 1, 2, 2 and 8.
How do I read a stem and leaf plot?
Read each line as the stem followed by the leaves, and combine each stem with each leaf using the key. The key says what one pair means. For example, the key “Key: 4 | 5 means 45 (leaf unit 1)” tells you that stem 4 with leaf 5 is the value 45.
A line such as 5 | 2 8 holds two values, 52 and 58. Because the leaves are sorted, the plot shows how many values fall in each range and how they spread out. Longer lines mean more values in that stem.
What is the leaf unit?
The leaf unit is the place value of the digit used as the leaf. The options are Automatic, 100, 10, 1, 0.1, 0.01 and 0.001. Leaf unit 1 uses the ones digit as the leaf, 0.1 uses the tenths digit, and 10 uses the tens digit.
The formula is: divide the value by the leaf unit and cut the result to a whole number, which gives k. Then stem = floor(|k| ÷ 10) and leaf = |k| mod 10. Automatic picks a power of 10 that gives between 1 and 10 stems for your range, but it never goes finer than the decimals in your data. Whole numbers never get a tenths digit.
How do I handle decimals or negative numbers in a stem and leaf plot?
For decimals, choose a leaf unit that reaches the digit you need, such as 0.1 for tenths. With leaf unit 0.1, the values 1.2, 1.5 and 1.9 all have stem 1, and their leaves are 2, 5 and 9.
Digits beyond the leaf are handled by truncation or rounding. With leaf unit 1, 23.7 becomes stem 2 leaf 3 when cut off, but stem 2 leaf 4 (24) when rounded. Rounding 29.6 gives 30, which is stem 3 leaf 0.
For negative values, the sign stays on the stem, and the leaf is the digit as usual. With leaf unit 1, −23 is stem −2 leaf 3, and −7 is stem −0 leaf 7. Within each line, the leaves are always listed from the smallest value to the largest.
What does split stems mean?
Split stems means Two lines per stem, which puts the leaves 0 to 4 on one line and the leaves 5 to 9 on a second line that uses the same stem. It spreads the leaves over more lines, so a plot with only a few stems shows more of its shape.
The 8-value preset, 12 15 21 22 22 28 31 34, gives only three stems: 1 | 2 5, 2 | 1 2 2 8 and 3 | 1 4. The tool shows a hint suggesting two lines per stem when a plot has only one or two stems. With that setting, the stem 2 would be split into leaves 1, 2, 2 on one line and leaf 8 on the next.
How do I find the median from a stem and leaf plot?
Count n ÷ 2 leaves from either end of the plot. If n is odd, the middle leaf is the median. If n is even, the median is the average of the two middle values.
In the 20 test scores on the page, n ÷ 2 is 10. Counting from the smallest value, the 10th value is 72 and the 11th is 75, so the median is (72 + 75) ÷ 2 = 73.5. The tool counts this for you and prints the median in the result rows.
Worked examples
| Input | Result |
|---|---|
| 20 values | 6 lines, leaf unit 1 |
| 8 values | 3 lines, leaf unit 1 |
| 10 values | 3 lines, leaf unit 0.1 |
| 7 values | 11 lines, leaf unit 1 |
| 12 values | 9 lines, leaf unit 10 |
Calculated by the tool above with these values.
Frequently asked questions
What is a stem and leaf plot used for?
It shows each individual value and the shape of the data in one diagram. You can see where values cluster, where gaps are, and where the median sits.
Why are there empty lines in my plot?
Stems with no data between the smallest and largest stem are kept as empty lines. This keeps the gaps in the data visible.
What does the warning about more than 25 lines mean?
It means the plot is long and may be hard to read. Choose a larger leaf unit to reduce the number of stems.
Why did I get an error about 120 lines?
The plot would need more than 120 lines at the current leaf unit. Choose a larger leaf unit, such as 10 instead of 1, to fit the plot into fewer lines.
What is the difference between truncating and rounding?
Truncating cuts off the digits beyond the leaf, so 23.7 becomes 23. Rounding moves to the nearest leaf, so 23.7 becomes 24 when the leaf unit is 1.
Is my data uploaded anywhere?
No. Nothing is uploaded, so the numbers you paste stay in your browser.
How many values can I enter?
You can enter up to 2,000 values. Paste them separated by commas, spaces or new lines.
Related tools
- Standard deviation calculator: use it when you need to measure how spread out your values are around the mean.
- Mean, median and mode calculator: use it when you want the mean or mode as well as the median.
- Box and whisker plot calculator: use it when you want a plot of the quartiles and range of your data.
- Statistics calculator: use it when you need a general set of statistics for your numbers.
- Percentile calculator: use it to find the value below which a given share of the data falls.
- Scatter plot maker: use it to plot paired x and y values.
- Correlation coefficient calculator: use it to measure how two variables move together.