Stanine Calculator
Enter a raw score with the mean and SD, a z-score, a percentile or a list of scores to get the stanine, its meaning and the percentile.
Recent
Your last 10 settings, saved only in this browser. Nothing is uploaded.
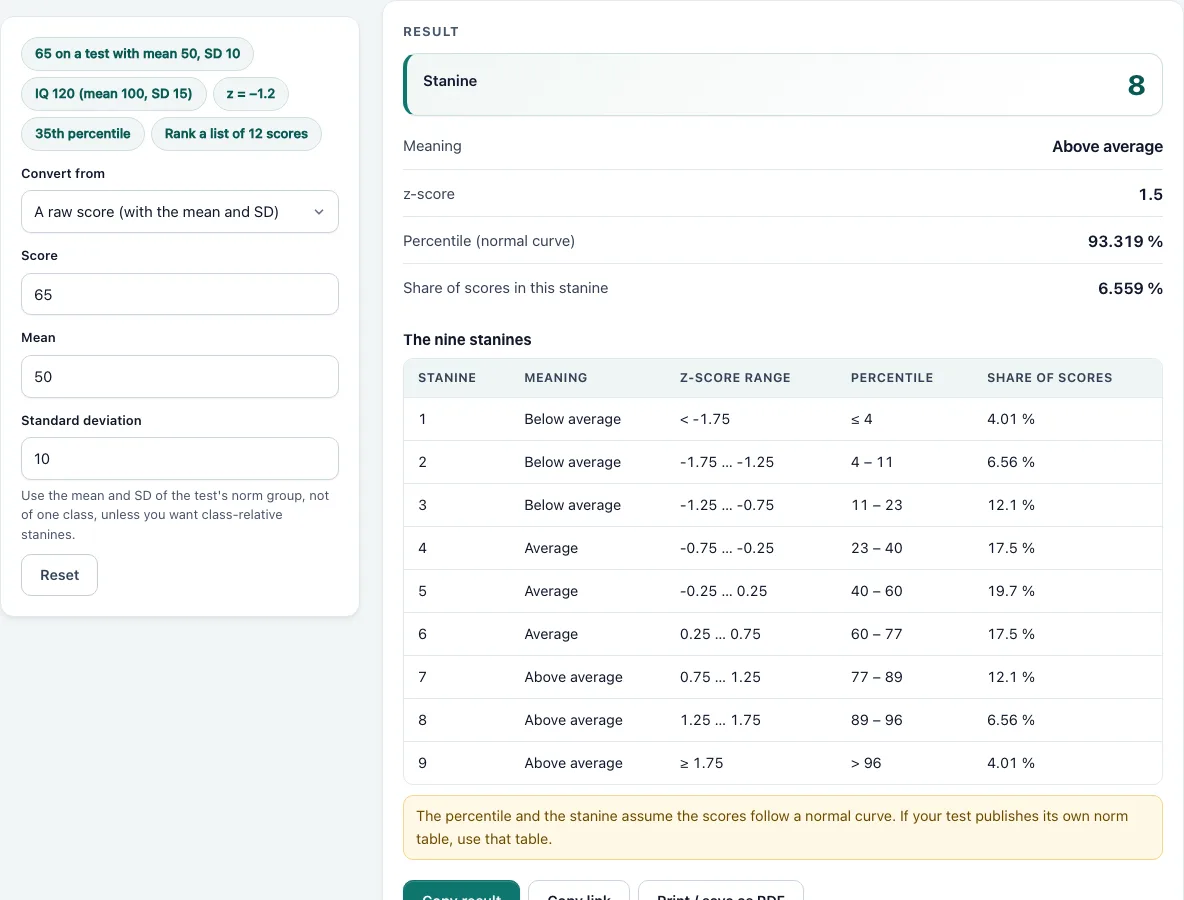
How to use the Stanine calculator
- Open the Convert from menu and choose your input: A raw score (with the mean and SD), A z-score, A percentile, or A list of scores (rank them).
- For a raw score, type the value into Score, then enter the Mean and the Standard deviation. The standard deviation must be greater than zero.
- For a z-score, enter the z-score directly.
- For a percentile, enter a number from 0 to 100.
- For a list, paste at least two scores separated by commas, spaces or new lines. The tool accepts up to 100,000 scores.
- Read the result. Single-score modes show the Stanine, Meaning, z-score, Percentile (normal curve) and Share of scores in this stanine. List mode shows a table with each different score, how often it occurs, its percentile rank and its stanine, plus the count of scores in each stanine.
- Check for a warning under the result if an input is unusual, then scroll down to the numbered steps that show the working.
Preset chips load example inputs, which is a quick way to see how each mode behaves. Copy link stores your inputs in the page address so you can share the same calculation. Print / save as PDF prints the result, and Copy result copies the result lines.
What is a stanine?
A stanine, short for “standard nine”, is a score from 1 to 9. It sits on a scale with a mean of 5 and a standard deviation of 2. The scale was designed so that a single digit describes where a score falls within a group. A stanine of 1 is the lowest band and 9 is the highest, with 5 in the middle.
Stanines 1, 2 and 3 are labelled Below average, 4, 5 and 6 are Average, and 7, 8 and 9 are Above average. Because the bands are wide, a stanine gives a rough picture rather than an exact rank. The bands are also not equal in size. Under a normal curve, stanine 5 holds about 19.74 % of scores, stanines 4 and 6 about 17.47 % each, stanines 3 and 7 about 12.10 % each, stanines 2 and 8 about 6.56 % each, and stanines 1 and 9 about 4.01 % each.
How do you convert a score or percentile to a stanine?
For a raw score, first find the z-score: z = (score − mean) ÷ SD. Then calculate stanine = 2z + 5, round to a whole number, and keep the result between 1 and 9. A value ending in exactly .5 rounds up. A z-score can be used directly in the same formula.
For a percentile, the tool uses the usual percentile chart with these cut-offs: up to 4 is stanine 1, up to 11 is stanine 2, up to 23 is stanine 3, up to 40 is stanine 4, up to 60 is stanine 5, up to 77 is stanine 6, up to 89 is stanine 7, up to 96 is stanine 8, and above 96 is stanine 9. So the 35th percentile falls in stanine 4.
For a list of scores, each score gets a percentile rank: (scores below it + half of the scores equal to it) ÷ n × 100, where n is the total number of scores. The same cut-offs then apply, and equal scores always get the same stanine. For example, in the list 45, 52, 58, 61, 61, 67, 70, 73, 78, 82, 85, 90, each 61 has a percentile rank of (3 + 1) ÷ 12 × 100 = 33.3, which places both in stanine 4.
Worked examples
| Input | Result |
|---|---|
| score 65, mean 50, SD 10 | Stanine 8 (Above average), percentile 93.32 |
| z = -1.2 | Stanine 3 (Below average), percentile 11.51 |
| percentile 35 | Stanine 4 (Average), percentile 35 |
| a list of 12 scores | stanine counts 1: 0 · 2: 1 · 3: 2 · 4: 2 · 5: 2 · 6: 2 · 7: 2 · 8: 1 · 9: 0 |
Calculated by the tool above with these values.
Frequently asked questions
What do stanines 1 to 9 mean?
Stanines 1 to 3 are below average, 4 to 6 are average, and 7 to 9 are above average. Under a normal curve, stanine 5 covers the middle fifth of a group, which is roughly the 40th to 60th percentile. Stanines 1 and 9 hold the smallest shares of scores.
How is a stanine different from a percentile or z-score?
A percentile gives the share of scores at or below a result, out of 100. A z-score gives the distance from the mean in standard deviations. A stanine groups those values into nine bands, so it is less precise than either but easier to compare quickly.
Why do different charts give slightly different percentile cut-offs for stanines?
Stanine boundaries come from the normal curve, and charts differ in how they round those boundaries to whole percentiles. In this tool the percentile and list modes use the whole-number cut-offs 4, 11, 23, 40, 60, 77, 89 and 96, while the raw-score and z-score modes use the exact normal-curve boundaries. A score right on a boundary can therefore land one stanine apart between modes. A test with its own norm table should be read from that table.
Why is my stanine capped at 1 or 9?
Any score more than 2.25 standard deviations from the mean is capped at stanine 1 or 9, and the tool shows a warning when this happens. The stanine scale does not go beyond those limits, so the cap keeps the result within the scale.
Why does the tool say my stanine is rough?
A list with fewer than 30 scores gets a warning because a small group gives unstable percentile ranks. Treat those stanines as a rough guide, and use a larger group if you need firmer results.
Does the stanine calculator assume my scores are normal?
Raw-score and z-score modes use the normal curve, so they work best when scores are roughly bell-shaped. List mode ranks your actual scores instead, so it does not assume a normal curve, and percentile mode reads the chart directly. If your data is strongly skewed, the raw-score and z-score results may be less reliable.
Related tools
- Percentile calculator: use this when you want the exact percentile rank of a score rather than a stanine band.
- Standard deviation calculator: use this to find the spread of a set of scores before converting to a z-score.
- Mean, median and mode calculator: use this to find the mean you need for a raw score conversion.
- Weighted mean calculator: use this when each score counts for a different share of the final result.
- Box and whisker plot calculator: use this to see the spread and quartiles of a list of scores in a chart.
- Statistics calculator: use this when you need a wider set of statistical tools in one place.