Standard Deviation Calculator
Paste a list of numbers to get the sample or population standard deviation, variance and mean, with the full hand calculation.
Recent
Your last 10 settings, saved only in this browser. Nothing is uploaded.
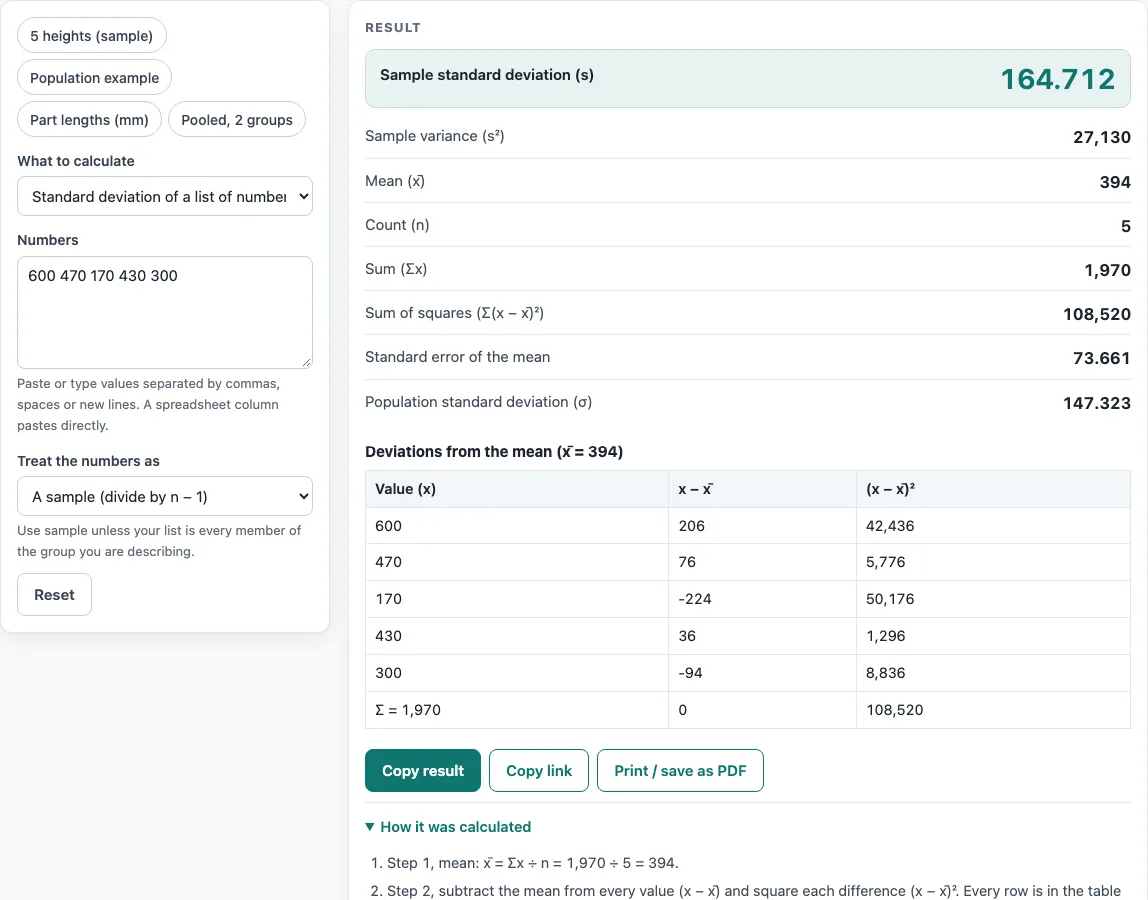
How to use the standard deviation calculator
- Under What to calculate, keep Standard deviation of a list of numbers, or choose Pooled standard deviation from groups.
- Type or paste your numbers into Numbers — the whole data set, one value per item. Commas, spaces, semicolons, tabs and new lines all separate values, so a spreadsheet column pastes straight in (up to 50,000 values).
- Under Treat the numbers as, keep A sample (divide by n − 1) or choose The whole population (divide by n).
- Read the large result: s for a sample, σ for a population. The other one is listed below it, followed by the variance, mean, count, sum, sum of squares and standard error of the mean.
- Open How it was calculated to see the five steps with your numbers, and the table of x, x − x̄ and (x − x̄)².
- For pooled mode, enter one group per line as
n, SD(up to 200 groups).
The result updates as you type. Preset buttons load typical cases such as 5 heights (sample) or Pooled, 2 groups. Copy result copies the result lines with a link, Copy link saves every input in the page address, Print / save as PDF gives a one-page record with the steps and date, and Reset restores the starting example.
How do you calculate, compute, find or work out standard deviation?
Standard deviation measures how far the values typically sit from their mean. To do it by hand: find the mean (sum ÷ n), subtract the mean from each value and square the result, add the squares, divide by n − 1 (sample) or n (population) to get the variance, then take the square root.
How to calculate standard deviation: formula, example and step by step
Sample formula: s = √( Σ(x − x̄)² ÷ (n − 1) ). Population formula: σ = √( Σ(x − μ)² ÷ n ). Example with the heights 600, 470, 170, 430 and 300: the mean is 394, the squared deviations add up to 108,520, the sample variance is 108,520 ÷ 4 = 27,130 and s = √27,130 = 164.712. The standard error of the mean is 164.712 ÷ √5 = 73.6614.
How do you find, calculate or compute sample and population standard deviation?
Use the sample formula when your numbers are a subset of a larger group you want to describe; use the population formula when the list contains every value you care about. The same heights as a population give a variance of 108,520 ÷ 5 = 21,704 and σ = 147.323. The textbook population 2, 4, 4, 4, 5, 5, 7, 9 has mean 5, variance 4 and σ = 2 exactly; treated as a sample it gives s = 2.13809.
How to find or calculate the mean and standard deviation (SD) of a data set in statistics
Paste the whole data set: the mean (average) and the standard deviation come out of the same calculation, because the mean is step one. This is how to calculate SD in statistics classes and how to find SD for lab replicates alike — whatever the group of data items, paste them in one list.
How to find or calculate standard deviation from variance (standard deviation and variance)
The standard deviation is the square root of the variance, and the variance is the standard deviation squared. A sample variance of 27,130 gives s = √27,130 = 164.712. The calculator shows both, so you never need to convert by hand.
How do you find or calculate pooled standard deviation in statistics for several groups?
When groups differ in size, the pooled standard deviation weights each group’s variance by its degrees of freedom: sp = √( Σ(nᵢ − 1)sᵢ² ÷ Σ(nᵢ − 1) ). For groups (n = 20, SD = 4) and (n = 30, SD = 5): (19 × 16 + 29 × 25) ÷ 48 = 21.4375, so sp = 4.63006 on 48 degrees of freedom. Each n must be a whole number of at least 2. This is how to calculate pooled standard deviation for a two-sample t test or an effect size.
Worked examples
| Input | Result |
|---|---|
| 5 values, sample | mean 394, standard deviation 164.7 |
| 8 values, population | mean 5, standard deviation 2 |
| 10 values, sample | mean 10.29, standard deviation 0.1197 |
| 3 groups, 30 observations | pooled SD 2.693 on 27 degrees of freedom |
| 2 groups, 50 observations | pooled SD 4.63 on 48 degrees of freedom |
Calculated by the tool above with these values.
Frequently asked questions
Does this standard deviation calculator work step by step?
Yes. The steps list the mean, the squared deviations, their sum, the division by n − 1 or n and the square root, and the table shows each value’s deviation and square (the first 50 rows; every result uses all values).
How to find standard deviation example with only a few values?
A sample standard deviation needs at least two values: with one value the sample basis gives an error and the population basis gives 0. Fewer than five values brings a warning that the result is a rough estimate.
How do you find standard deviation using the mean, or with mean and sample size only?
You can’t: the mean and the sample size say nothing about spread. You need the individual values (or a reported SD or variance). With the values, the calculator finds the mean first and then the standard deviation.
What does a standard deviation of 0 mean?
Every value is identical, so none differs from the mean. The calculator shows a warning in that case.
Is the calculator free, and is anything I type uploaded?
It is free, needs no account, and everything is calculated in your browser; nothing you type is uploaded.
Can I print or share a calculation?
Yes. Print / save as PDF gives a one-page record with inputs, results, steps and date, and Copy link stores your numbers in the page address so the same calculation reopens later.
Can I use the results in a report?
Yes, in any work including commercial reports, theses and client projects, without attribution. Check that the method’s assumptions fit your data before you report them.
Related tools
- Statistics calculator — all summary statistics for one data set at once.
- Mean, median and mode calculator — the centre of your data before its spread.
- Relative standard deviation calculator — the SD as a percentage of the mean.
- Box and whisker plot calculator — quartiles, IQR and outliers in one picture.
- Percentile calculator — where a value ranks in your data.
- Confidence interval calculator — turn the mean and SD into a range for the true mean.
- T test calculator — compare two means using their standard deviations.
- Effect size calculator — Cohen’s d from means and pooled SD.