Spearman Rank Correlation Calculator
Paste x, y pairs to get Spearman's rho with mid-ranks for ties, the p-value and a table of ranks, d and d².
Recent
Your last 10 settings, saved only in this browser. Nothing is uploaded.
How to use the Spearman rank correlation calculator
- Enter your data. Type one “x, y” pair per line, separated by a comma, space, tab or semicolon. Or put all the x values on a line starting “x:” and all the y values on a line starting “y:”. You can paste numbers straight from a spreadsheet column.
- Optionally, add a first line with two column names. They label the plot axes.
- Make sure you have at least 3 pairs.
- To start from a typical case, click a preset button above the form: math and science scores, IQ and TV hours, two judges ranking, or study hours and test errors.
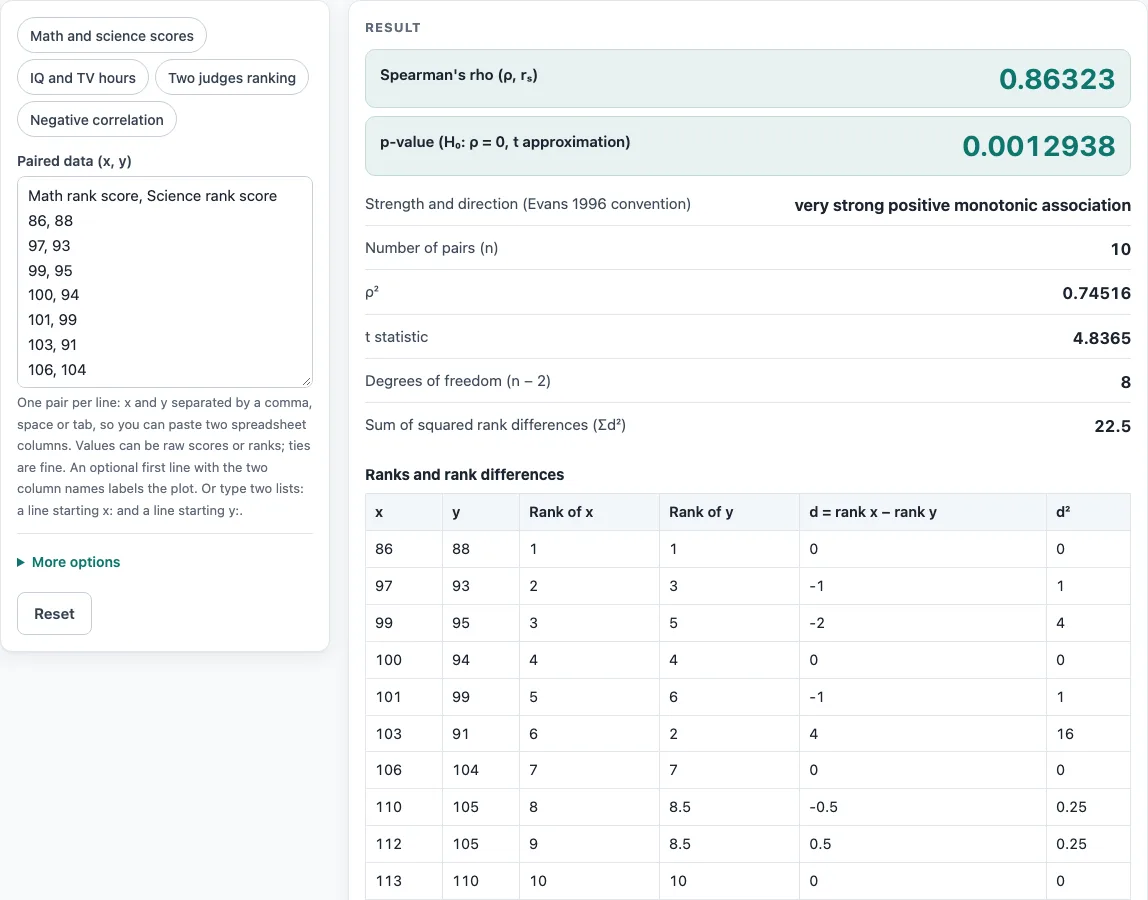
- Read the result. It updates as you type. It shows rho, the strength and direction label, n, the p-value, ρ², t and the degrees of freedom.
- Choose the tail for the p-value: two-tailed (the default), right-tailed or left-tailed.
- Open “How it was calculated” under the result to see the formula, the values substituted and the answer.
- Check the table and the plot. The table lists x, y, rank x, rank y, d and d² for each pair, and the plot shows the ranks.
- Click Reset to restore the starting example.
The page also has Copy result, Copy link and Print / save as PDF buttons for sharing and saving your work.
How is the Spearman rank correlation coefficient calculated?
Spearman’s rho works on ranks rather than raw values. Each variable is ranked separately, from smallest (rank 1) to largest. Tied values receive the average of the ranks they would occupy, called mid-ranks. Rho is then the Pearson correlation of the two rank lists, which is correct with or without ties.
When there are no ties, a shortcut gives the same answer: ρ = 1 − 6Σd² / (n(n² − 1)), where d is rank x minus rank y for each pair. The shortcut is inexact with tied values, so the page shows it only when neither variable has ties. In the IQ and TV example (10 people, no ties), Σd² = 194 and the shortcut gives ρ = −0.17576, the same value as the full calculation.
How is the p-value for Spearman’s rho found?
To test H₀: ρ = 0 (no monotonic association), the calculator uses t = ρ√(n − 2)/√(1 − ρ²) with n − 2 degrees of freedom, the approximation used by most statistics software. It is rough for small samples: below 10 pairs the page warns you and suggests comparing ρ with an exact critical-value table for Spearman’s rank correlation coefficient. For the IQ and TV example, ρ = −0.17576 with 8 degrees of freedom is far from significant at the usual 5 % level, so the data give no evidence of a monotonic relationship.
When should you use a rank correlation instead of Pearson’s r?
Use Spearman’s rho when the data are ranks or ordinal ratings (such as 1–5 survey answers or judges’ placings), when the relationship rises or falls steadily but is curved, or when one or two outliers would dominate Pearson’s r. Because each value is replaced by its rank, an extreme value can move rho only as far as one rank position. If the relationship is a straight line and the data have no outliers, Pearson’s r on the raw values is more powerful.
Worked examples
| Input | Result |
|---|---|
| 10 (x, y) pairs | ρ = 0.8632, p = 0.0012938 |
| 10 (x, y) pairs | ρ = -0.1758, p = 0.62719 |
| 8 (x, y) pairs | ρ = 0.9048, p = 0.0020083 |
| 7 (x, y) pairs | ρ = -0.955, p = 4.0277 × 10⁻⁴ |
Calculated by the tool above with these values.
Frequently asked questions
Is the calculator free, and is anything I type uploaded?
Yes, the calculator is free, and nothing you type is uploaded. Everything is calculated in your browser, and there is no account or sign-up.
Results may be used in any work, including commercial reports, theses and client projects, without attribution. Results are calculated from the data you enter, so check that the method’s assumptions fit your data before you report them.
Can I print or share a calculation?
Yes. Print / save as PDF produces a one-page record with the inputs, the results, the calculation steps and the date.
Copy link copies the page address. That address stores every input in the ?s= part of the URL, so the same calculation reopens later or can be sent to a colleague. Copy result copies the result lines with a link, which is useful for pasting into a report.
What is the difference between Spearman and Pearson correlation?
Spearman’s rho uses ranks, so it measures any consistently rising or falling relationship and is less sensitive to outliers. Pearson r uses the actual values and measures how closely the points follow a straight line.
Why is the shortcut formula missing from my result?
The shortcut is shown only when neither variable has ties, because it is inexact with tied values. With ties, the page says the shortcut is not used, and rho is still calculated correctly from the ranks.
What does the warning about fewer than 10 pairs mean?
The p-value uses a t approximation, which is rough for small samples. For small n, compare your rho with an exact critical-value table for Spearman’s rho. The calculator does not compute exact permutation p-values.
Why does the calculator show an error when all my x values are the same?
If all x values are equal, or all y values are equal, every rank is tied and rho is undefined. Check that both columns contain different values.
Does a high Spearman rho mean one variable causes the other?
No. Rho describes an association, not cause and effect. Interpret it alongside how your data were collected.
Can I paste numbers directly from a spreadsheet?
Yes. Commas, spaces, tabs and new lines all separate values, so you can copy columns from a spreadsheet. Keep the x and y values in the same row order so each pair matches.
Related tools
- Correlation coefficient calculator: use it when you want the Pearson r for a straight-line relationship between two variables.
- Linear regression calculator: use it when you want to predict one variable from another with a fitted line.
- Multiple regression calculator: use it when you want to model an outcome using more than one predictor.
- P-value calculator: use it when you already have a test statistic and need its p-value.
- Which statistical test to use: use it when you are unsure which test fits your data and question.
- Statistics calculator: use it to browse the other calculators on the site.