Sample Size Calculator
Set the confidence level and margin of error (or the difference and power) to get the sample size you need, rounded up, with the formula.
Recent
Your last 10 settings, saved only in this browser. Nothing is uploaded.
How to use the sample size calculator
- Open the mode select and pick survey, estimate a mean, compare two means, or compare two proportions.
- For a survey, enter the confidence level in percent (default 95) and the margin of error in percentage points (default 5).
- Enter the expected proportion p in percent. The default of 50 is the safest choice when you have no estimate.
- Optionally enter a population size N. Leave it empty if the population is very large.
- For a mean, enter the standard deviation σ and the margin of error E in the units of the mean. For two groups, enter the difference to detect δ, the standard deviation σ, and the power in percent (default 80).
- Read the required sample size. It updates as you type.
- Open “How it was calculated” under the result to see the formula, the values substituted and the answer.
- If you already have a fixed number of respondents, use the optional advanced field in survey mode to see the margin of error that number gives.
Under More options you can change α and choose a one- or two-tailed test in compare-means mode. “Copy link” saves every input in the ?s= part of the page address, so the same calculation reopens later or goes to a colleague. “Copy result” copies the result lines with a link. “Print / save as PDF” produces a one-page record with the inputs, results, steps and date. “Reset” returns to the starting example.
How is the sample size for a survey calculated?
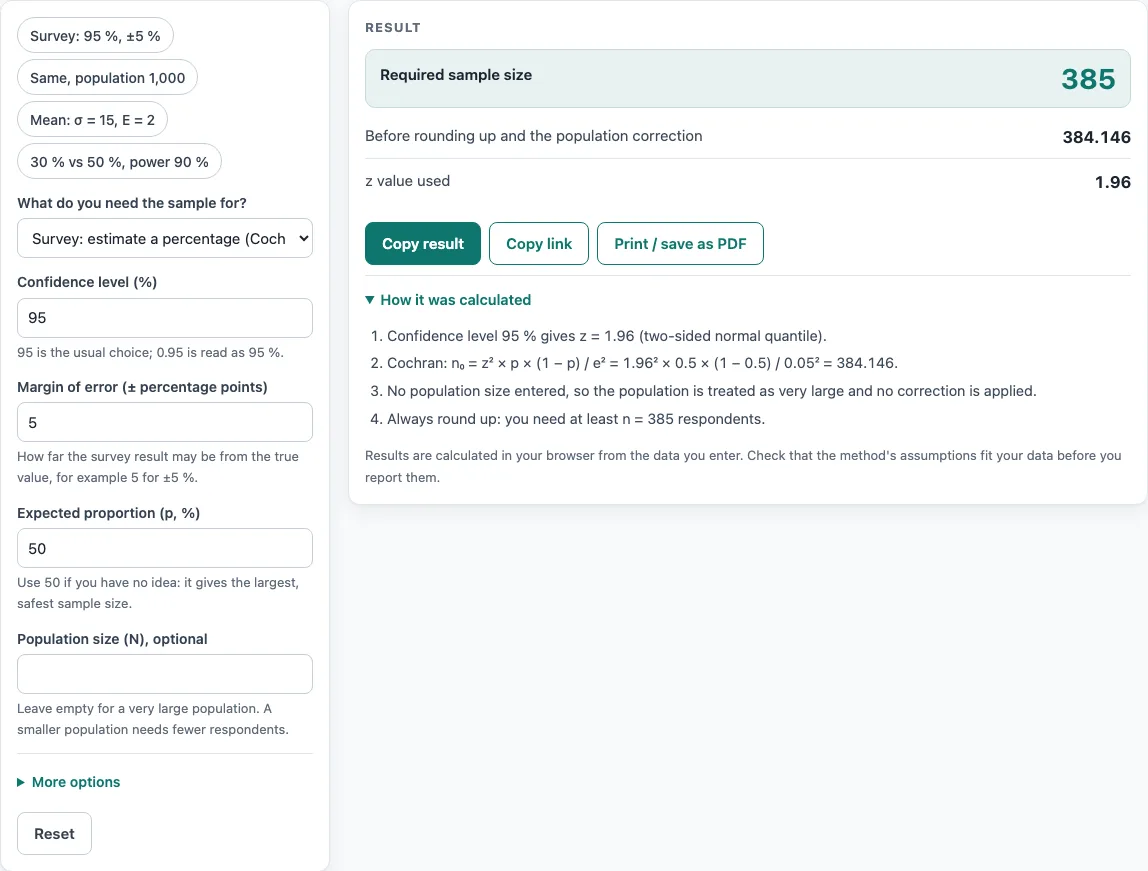
Survey mode uses Cochran’s formula, n₀ = z² × p × (1 − p) / e². Here z is the two-sided normal quantile for your confidence level (1.96 for 95%), p is the expected proportion as a fraction, and e is the margin of error as a fraction. For 95% confidence, ±5% and p = 50%, the calculation is 1.96² × 0.5 × 0.5 / 0.05² = 384.1. The result is rounded up to 385. Setting p to 50% gives the largest possible value of p × (1 − p), which is why it is the safe default. The calculator warns when the margin of error is larger than p or 1 − p, or when p is below 5% or above 95%.
What does the finite population correction do?
The finite population correction reduces the sample size when the population is small enough that sampling a large share of it matters. With a population size N, the calculator uses n = n₀ / (1 + (n₀ − 1) / N). For n₀ = 384.1 and N = 1,000, this gives 278. With N left empty, the population is treated as very large and no correction is made. The calculator warns when the sample equals the whole population.
How is the sample size for a mean calculated?
Estimate-a-mean mode uses n₀ = (z × σ / E)², where σ is the population standard deviation and E is the margin of error in the units of the mean. For σ = 15 and E = 2 at 95% confidence, the result is (1.96 × 15 / 2)² = 216.1, rounded up to 217. The formula uses z, which assumes σ is known. If σ comes from a small pilot study, plan for a few extra respondents.
How are two groups compared?
Compare-means mode calculates the size of each group as n = 2 × (z_α + z_power)² / d², where d = δ / σ and δ is the difference you want to detect. The result is rounded up per group, and the total for both groups is shown. For δ = 5, σ = 10, 80% power and α = 0.05 (two-tailed), d = 0.5 and n = 2 × (1.96 + 0.8416)² / 0.25 = 62.8, so 63 per group and 126 in total.
Compare-proportions mode uses the same formula with Cohen’s h = 2·asin(√p₁) − 2·asin(√p₂) as the effect size. Comparing 30% with 50% at 90% power needs 125 per group. Both two-group modes use a normal approximation with equal group sizes. The exact noncentral t method needs a few more subjects, and the power analysis calculator checks the power for a given sample size.
Worked examples
| Input | Result |
|---|---|
| Survey: 95 % confidence, ±5 %, p = 50 %, population very large | n = 385 |
| Survey: 95 % confidence, ±5 %, p = 50 %, population 1000 | n = 278 |
| Survey: 99 % confidence, ±3 %, p = 50 %, population very large | n = 1,844 |
| Mean: 95 % confidence, σ = 15, E = 2 | n = 217 |
| Two means: δ = 5, σ = 10, α = 0.05, power 80 % | n = 63 per group (126 in total) |
| Two proportions: 30 % vs 50 %, α = 0.05, power 90 % | n = 125 per group (250 in total) |
Calculated by the tool above with these values.
Frequently asked questions
How do you calculate or determine sample size, and how do you report it?
Calculating sample size means choosing the formula for your goal (Cochran’s formula for a survey proportion, (zσ/E)² for a mean, or the two-group power formula), filling in the confidence level, margin of error or effect, and rounding up. The steps under the result show the determination of sample size formula (equation) with your numbers, so you can quote exactly how the sample size was calculated — the computation of sample size, the number of samples formula and the result — in one line of a report. That makes it a sample size calculator for determining sample size and documenting it at the same time.
Can I print or share a calculation?
Yes. “Copy link” copies the page address, which stores every input, so the calculation reopens exactly as you left it. “Copy result” copies the result lines with a link. “Print / save as PDF” creates a one-page record with the inputs, results, calculation steps and date.
Is the calculator free, and is anything I type uploaded?
Yes, the calculator is free and needs no account or sign-up. Everything is calculated in your browser, so nothing you type is uploaded. Results may be used in any work, including commercial reports, theses and client projects, without attribution.
What sample size do I need for 95% confidence and a ±5% margin of error?
Use survey mode with p = 50%. The required sample size is 385 people. This is the default setting, so the result appears as soon as the page loads.
What if my population is small?
Enter the population size in the optional N field. For a population of 1,000, the required sample falls to 278.
Why is the result rounded up?
A sample smaller than the formula gives would leave the margin of error or the power short of the target. Rounding up keeps the calculated target.
What if I do not know the expected proportion?
Keep p at 50%. It gives the largest sample size, so it is the safest choice when you have no estimate.
What margin of error will I get from 385 respondents?
Enter 385 in the optional advanced field in survey mode. At 95% confidence the margin of error is ±4.994 percentage points.
Related tools
- Power analysis calculator: use it to check the power for a sample size you already have.
- Effect size calculator: use it to work out the effect size before you plan a comparison.
- Confidence interval calculator: use it to build an interval around a result from your data.
- T test calculator: use it to test a difference between two means after collecting data.
- Odds ratio calculator: use it to compare the odds of an outcome between two groups.
- Chi-square test calculator: use it to test whether counts in categories differ from what you expect.