Power Analysis Calculator
Pick a test and solve for power, sample size or the smallest detectable effect; the power curve shows how power grows with n.
Recent
Your last 10 settings, saved only in this browser. Nothing is uploaded.
How to use the power analysis calculator
- Pick one of the four tests: two-sample t test, one-sample or paired t test, two proportions, or correlation.
- Set Solve for to the unknown you need: the sample size n, the power, or the minimal detectable effect.
- Enter the effect size. For t tests use Cohen’s d. For two proportions enter p₁ and p₂ in percent. For correlation enter r.
- Enter α (0.05 is the usual choice) and, if you are not solving for power, the target power, such as 80 %.
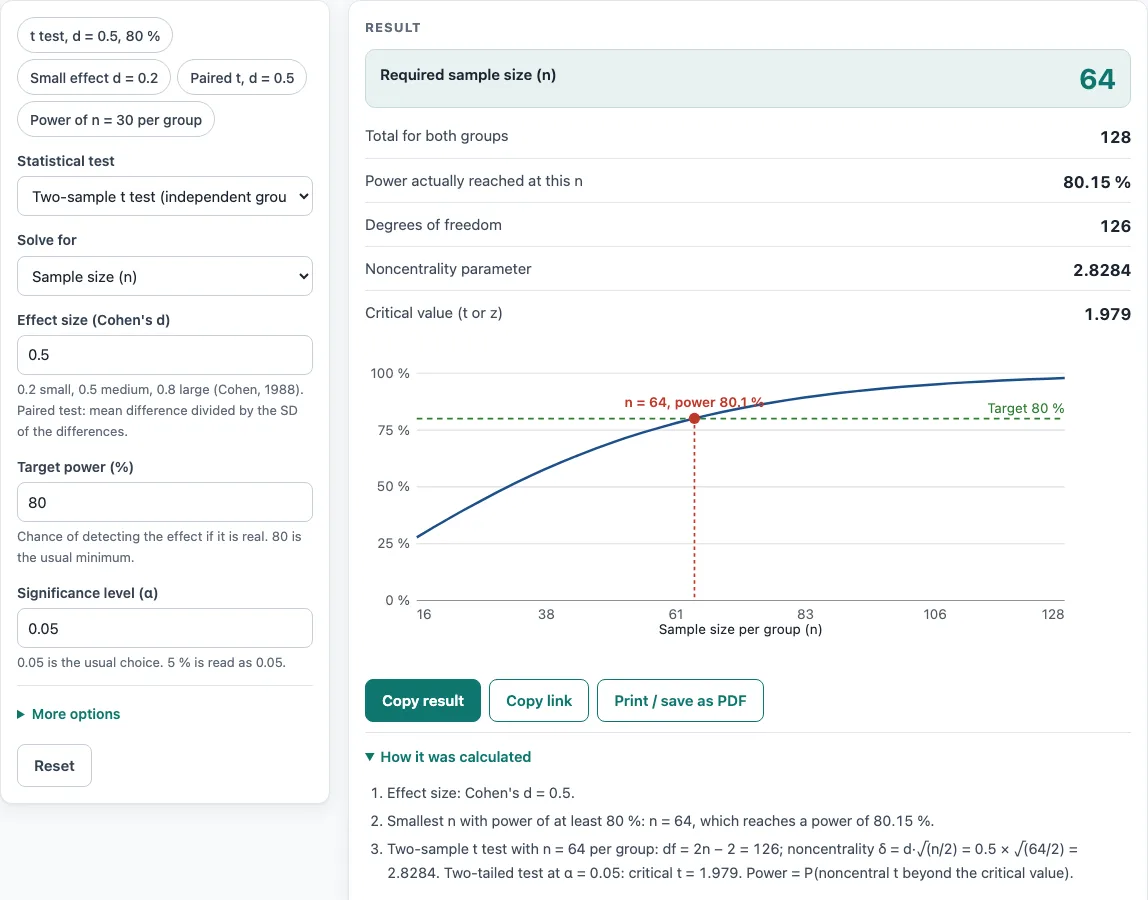
- Read the result. For a sample size it gives the smallest whole n that reaches the target, the power actually reached, and the total for both groups in a two-group test.
- Check any warnings, then look at the power curve, where the solved point is marked and the target power is a dashed line.
- Open How it was calculated to see the formula and the values substituted.
The result updates as you type, so you can change one value and watch the answer move. Use the preset buttons above the form to load typical cases, or Reset to return to the starting example. Copy link saves every input in the page address, Copy result copies the result lines with a link, and Print / save as PDF produces a one-page record.
What is power analysis?
Power analysis is a way of planning a study before any data are collected. It asks how likely a study is to detect an effect of a given size, if that effect really exists. The chance of a correct detection is the power, and the chance of a false alarm is the significance level α.
Three quantities are linked: the effect size, the sample size and the power, with α fixed. If you know any two, you can work out the third. A small expected effect needs many more subjects than a large one to reach the same power. This is why the calculator lets you solve for whichever value you do not yet know.
For t tests the effect size is Cohen’s d, the difference between means measured in standard deviations. For proportions the calculator converts the two percentages to Cohen’s h, and for correlation it uses r. Cohen (1988) gives the conventions behind these measures.
What does the power number tell you?
Power is a probability, so 80 % means that, in a study of this size, a real effect of the stated size would be detected about four times in five. Researchers often aim for 80 % power, which is a common convention rather than a rule.
The calculator finds power from the noncentral t distribution for t tests. The noncentrality is d × √(n/2) for two groups, with df = 2n − 2, and d × √n for one sample or pairs, with df = n − 1. Power is the chance that this noncentral t falls beyond the critical value. For example, two groups of 30 with d = 0.5 and α = 0.05 give a power of 47.79 %, so such a study would miss a true medium effect more often than not.
When solving for n, the calculator returns the smallest whole n whose power reaches the target. When solving for the minimal detectable effect, it returns the smallest d, r or h that the chosen n can detect at that power.
Worked examples
| Input | Result |
|---|---|
| Two-sample t test (independent groups), d = 0.5, power 80 %, α = 0.05 | n = 64 |
| Two-sample t test (independent groups), d = 0.5, n = 30, α = 0.05 | power = 47.79 % |
| One-sample or paired t test, d = 0.5, power 80 %, α = 0.05 | n = 34 |
| Two proportions, p₁ = 50 %, p₂ = 60 %, power 80 %, α = 0.05 | n = 388 |
| Correlation, r = 0.3, power 80 %, α = 0.05 | n = 85 |
| Two-sample t test (independent groups), n = 30, power 80 %, α = 0.05 | minimal detectable effect = 0.7356 |
Calculated by the tool above with these values.
Frequently asked questions
Is the calculator free, and is anything I type uploaded?
Yes, the calculator is free and needs no account or sign-up. Everything is calculated in your browser, so nothing you type is uploaded.
Can I print or share a calculation?
Yes. Print / save as PDF prints a one-page record with the inputs, the results, the calculation steps and the date. Copy link copies a page address that stores every input, so the same calculation reopens later or can be sent to a colleague.
Can I use the results in a report or thesis?
Yes. The results may be used in any work, including commercial reports, theses and client projects, without attribution. Check that the method’s assumptions fit your data before you report them.
Can I use this to find the power of a study that is already finished?
Not from its observed effect. The calculator warns against this, because power computed from the effect you happened to observe adds little beyond the p-value. Power is most useful when it is planned from an effect size you consider meaningful, before the study starts.
Why does the proportion or correlation result warn about approximations?
The two-proportion power uses a normal approximation, and the correlation test uses the Fisher z transform, which is also an approximation. Exact methods can differ by about one subject, so treat the result as a planning estimate and check borderline cases with a dedicated method.
What does a one-tailed test change?
A one-tailed test counts only one tail of the distribution in the power, while a two-tailed test counts both. The calculator shows a warning for one-tailed tests, so choose the direction before you start the study and do not switch it after seeing the data.
Related tools
- Sample size calculator: use it when you mainly need the number of participants for a target precision or power.
- Effect size calculator: use it to turn means, proportions or correlations into the d, h or r that this calculator needs.
- Confidence interval calculator: use it to see the range of plausible values for an effect in your data.
- T test calculator: use it to run a t test on your own data after the study is complete.
- Odds ratio calculator: use it when your outcome is a yes or no result and you want to compare odds between groups.
- Chi-square test calculator: use it to test whether two categorical variables are associated in a table of counts.