Poisson Distribution Calculator
Enter the average rate λ and a count x to get the exact or cumulative Poisson probability, with the table and chart.
Recent
Your last 10 settings, saved only in this browser. Nothing is uploaded.
The Poisson distribution calculator gives the probability of a given number of events when events occur at a known average rate λ. You enter the rate and a count x, choose the probability you need (exact, at most, fewer than, more than, at least, or between two values), and read the answer. It is a free poisson calculator that runs in your browser, with no sign-up. The calculator covers counts from 0 up to very large averages, such as λ = 1000. For λ of 20 or more, it also shows a normal approximation for comparison, while the exact value stays the answer.
Use it as a Poisson probability calculator for call-centre arrivals, defects or website errors.
How to use the Poisson distribution calculator
- Enter the average rate λ in the λ box. It can be zero or any positive number. The default is λ = 3.5.
- Enter x, the number of events you want to test. Use a whole number from 0 to 10,000,000.
- Pick a probability option: P(X = x), P(X ≤ x), P(X < x), P(X > x), P(X ≥ x), or P(x₁ ≤ X ≤ x₂). For the last option, enter x₁ and x₂, where x₂ is not smaller than x₁.
- If the events happen over several intervals, open More options and set the number of intervals t. The calculator uses λ × t. For example, 2.5 events per hour over 4 hours means λ = 2.5 and t = 4, giving an effective rate of 10.
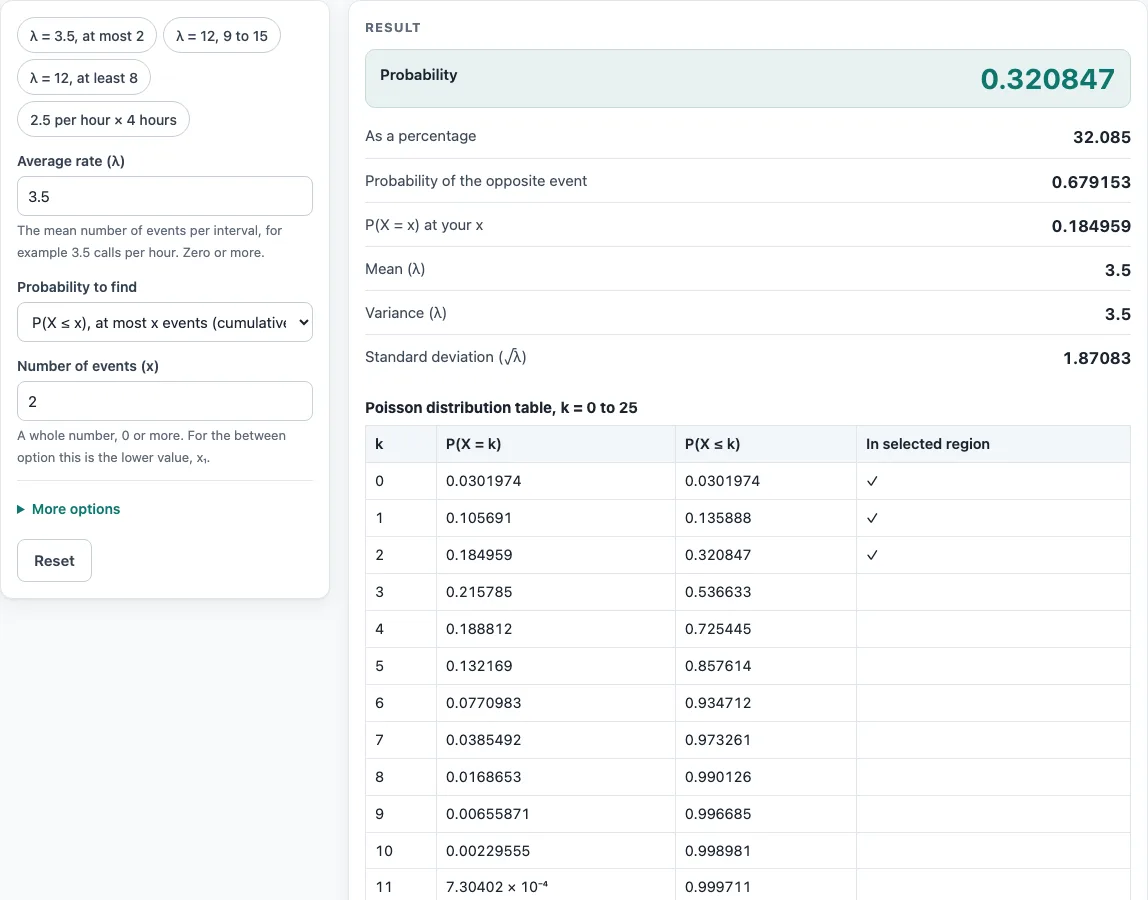
- Read the result. It updates as you type and shows the probability to 6 significant figures, as a percentage, the probability of the opposite event, and P(X = x). Open How it was calculated to see each step.
- Check the table and the bar chart. The selected region is marked in the table and shown in red in the chart.
Preset buttons above the form load typical cases. Reset restores the starting example.
Use Copy result to copy the result lines with a link, Copy link to copy an address that reopens the same inputs, or Print / save as PDF to save a one-page record.
How is a Poisson probability calculated?
The Poisson distribution counts how many events happen in a fixed interval — calls per hour, defects per metre, arrivals per day — when events occur independently at a constant average rate λ. The probability of exactly x events is P(X = x) = e^(−λ) λ^x / x!. Cumulative options add these terms: P(X ≤ x) sums from 0 to x, and P(x₁ ≤ X ≤ x₂) sums from x₁ to x₂. The mean and the variance both equal λ, and the standard deviation is √λ.
Example: a help desk receives 3.5 calls per hour on average. The chance of exactly 2 calls in an hour is e^(−3.5) × 3.5² / 2! = 0.184959, and the chance of at most 2 calls is 0.320847, about 32 %. With λ = 12, P(9 ≤ X ≤ 15) = 0.689388 and P(X ≥ 8) = 0.910496.
Changing the interval: rate × time
λ must match the interval you ask about. If a machine averages 2.5 stoppages per hour and you want the count over a 4-hour shift, the rate for the shift is 2.5 × 4 = 10. Set the number of intervals under More options and the calculator does the multiplication and shows it as a step.
When does the Poisson model fit?
Use it when events are independent, two events cannot happen at exactly the same instant, and the average rate stays the same across the interval. A quick check on real data is that the variance of the counts is close to their mean; if the variance is clearly larger, the counts are clustered (overdispersed) and the Poisson probabilities will be too optimistic in the tails. For a fixed number of trials with a success probability, such as 20 inspected parts, the binomial distribution is the right model; the Poisson distribution is its limit when n is large and p is small.
A worked check of the rate × time rule: 2.5 events per hour over 4 hours gives λ = 10, and the chance of exactly 10 events is 0.12511.
Worked examples
| Input | Result |
|---|---|
| λ = 3.5, P(X ≤ 2) | 0.320847 |
| λ = 12, P(9 ≤ X ≤ 15) | 0.689388 |
| λ = 12, P(X ≥ 8) | 0.910496 |
| λ = 10, P(X = 10) | 0.12511 |
| λ = 1,000, P(X > 1099) | 9.6263 × 10⁻⁴ |
Calculated by the tool above with these values.
Frequently asked questions
Is the Poisson calculator free, and is anything I type uploaded?
It is free, needs no sign-up, and everything is calculated in your browser; nothing you type is uploaded. Results may be used in any work, including commercial reports, without attribution.
Can I print or share a calculation?
Yes. Print / save as PDF gives a one-page record with inputs, results, steps and date, and Copy link stores the inputs in the page address.
What does λ mean, and can it be zero?
λ is the average number of events in the interval you are studying. It can be zero, but the calculator then shows a warning, because a rate of zero means no events occur.
What is the difference between P(X ≤ x) and P(X < x)?
P(X ≤ x) includes the value x itself, while P(X < x) stops one step below it. For whole-number counts, P(X < x) equals P(X ≤ x − 1).
When does the normal approximation to the Poisson distribution apply?
When λ is at least 20, a step shows the normal approximation with a continuity correction, so you can compare it with the exact value. The exact value is always the answer shown. The approximation is useful for hand calculation, but it is only an estimate.
Does the calculator work for very large averages?
Yes. The calculator uses Loader’s saddle-point algorithm, so large λ works. For example, λ = 1000 gives P(X = 1000) = 0.0126146.
Why do I see an error message?
An error appears when x, x₁ or x₂ is not a whole number from 0 to 10,000,000, when x₂ is smaller than x₁, or when λ × t is greater than 1,000,000. Fix the highlighted input and the result will update.
Related tools
- Binomial distribution calculator: use this when each trial has only two outcomes and the number of trials is fixed.
- P-value calculator: use this to turn a test statistic into a p-value once you have a probability to judge.
- Critical value calculator: use this to find the cut-off value for a chosen significance level.
- Which statistical test to use: use this when you are not sure which test fits your question.
- Odds ratio calculator: use this to compare the odds of an outcome between two groups.
- Statistics calculator: use this to browse the full set of calculators on the site.