Percentile Calculator
Paste a data set to find the k-th percentile or the percentile rank of a value, with the method and position shown step by step.
Recent
Your last 10 settings, saved only in this browser. Nothing is uploaded.
The percentile calculator finds the value at any percentile of a data set, or the percentile rank of a value within that data set. You paste your numbers, choose a percentile between 0 and 100, and pick one of three calculation methods. It runs free in your browser, with no sign-up. It works from raw values rather than a mean and standard deviation, so if you only have those two figures, the explanation below shows how to estimate a percentile. The result updates as you type, so you can test different percentiles or values quickly.
Results come with the position used in the sorted list, so you can follow the method by hand.
How to use the Percentile Calculator
- Choose a mode: The k-th percentile of the data to find a value at a given percentile, or The percentile rank of a value to find where a value sits in your data.
- Paste your numbers into the data box. Commas, spaces, semicolons, tabs or new lines all work, up to 50,000 values, so you can paste a spreadsheet column directly.
- In percentile mode, enter k between 0 and 100. In rank mode, enter the value x. It does not need to be in your list.
- Pick a method: linear interpolation (the default), exclusive, or nearest rank.
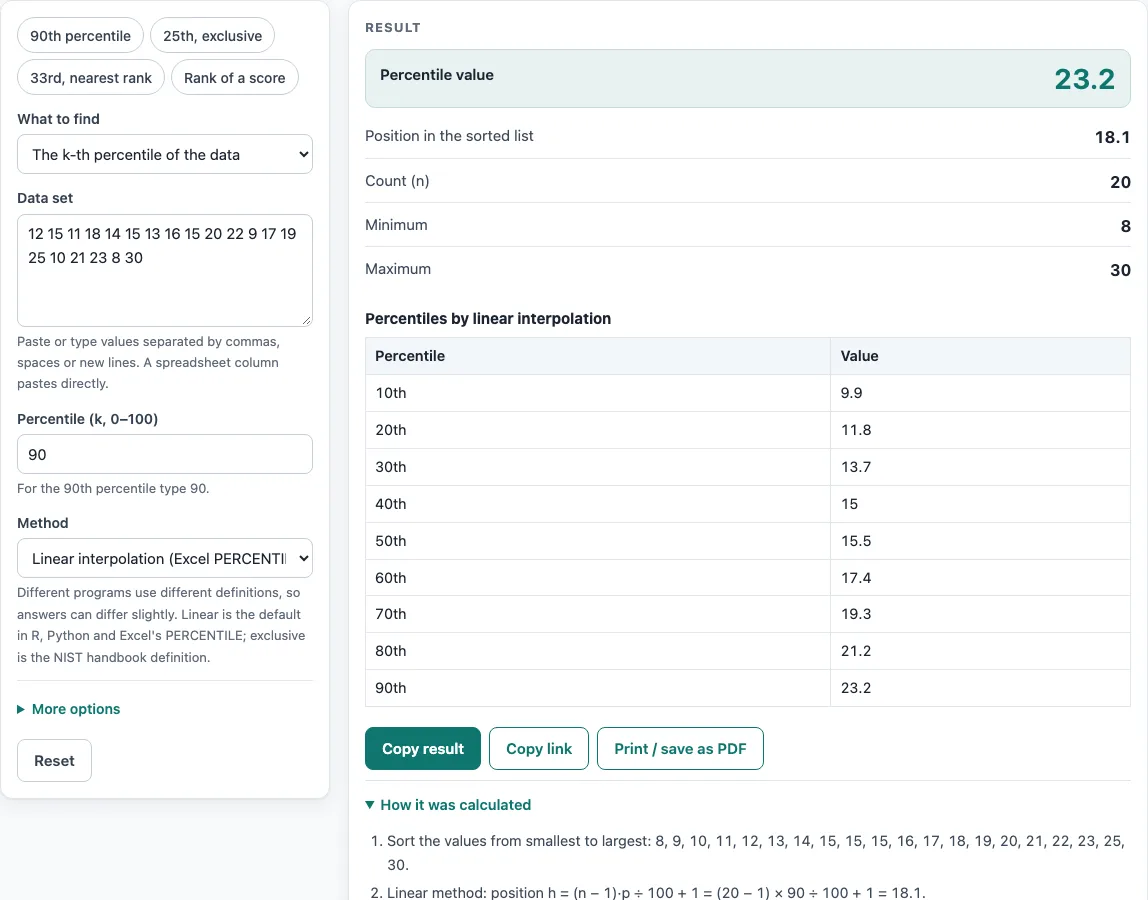
- Read the large result. Percentile mode also shows the position in the sorted list, n, the minimum and the maximum.
- Open How it was calculated under the result to see the sorted list, the position formula with your numbers, and the interpolation step.
- Read any warning. One fires for a single value, for fewer than 5 values, or when x falls outside the data range.
Preset buttons above the form load typical cases, such as the 90th percentile or a rank of a score. Under More options, a table of the 10th to 90th percentiles is shown by default. Copy link stores every input in the page address, so you can reopen the same calculation later or send it to a colleague. Print / save as PDF creates a one-page record with the inputs, results, steps and date. Reset restores the starting example.
How to find percentile with mean and standard deviation
A percentile cannot be found from the mean and standard deviation alone unless you assume the data follow a normal (bell-shaped) distribution. Under that assumption, convert the value to a z-score: z = (x − mean) ÷ standard deviation. The percentile is then the share of the normal curve below z, which you read from a standard normal table. With a mean of 100 and a standard deviation of 15, a value of 115 gives z = 1, which sits at about the 84th percentile. Searchers looking for a standard deviation percentile calculator are usually working this way.
How to calculate percentile with mean and standard deviation
To go the other way under the normal assumption, look up the z-score for the percentile you want and compute value = mean + z × standard deviation. For the 90th percentile, z is about 1.2816, so with a mean of 100 and a standard deviation of 15 the value is about 119.2. If you have the raw data, skip the assumption and use the values directly. This is the percentile calculator statistics approach that the tool uses.
For the default data (n = 20), the 90th percentile by linear interpolation is found as follows. The position is h = (n − 1) × k/100 + 1 = 19 × 0.9 + 1 = 18.1. The answer lies 10% of the way from the 18th sorted value (23) to the 19th (25), giving 23 + 0.1 × 2 = 23.2.
The exclusive method uses h = (n + 1) × k/100 and is only defined when h falls between 1 and n. For the same data, h = 18.9 and the result is 24.8. Nearest rank takes the value at rank ⌈k/100 × n⌉ with no interpolation, so the 90th percentile is the 18th value, 23.
For percentile rank, the tool counts values below x and values equal to x. For x = 15 in the default data, 7 values are below and 3 are equal. Percent strictly below is 7/20 = 35%, percent at or below is 10/20 = 50%, and the mid-rank figure is the average of the two, (7 + 1.5)/20 = 42.5%.
Worked examples
| Input | Result |
|---|---|
| 90th percentile of 20 values (Linear interpolation (Excel PERCENTILE.INC, R type 7)) | 23.2 |
| 25th percentile of 20 values (Exclusive (Excel PERCENTILE.EXC, R type 6)) | 12.25 |
| 33th percentile of 20 values (Nearest rank (no interpolation)) | 14 |
| rank of 15 among 20 values | mid-rank 42.5 %, below 35 %, at or below 50 % |
| rank of 20 among 20 values | mid-rank 72.5 %, below 70 %, at or below 75 % |
Calculated by the tool above with these values.
Frequently asked questions
Is the calculator free, and is anything I type uploaded?
Yes, the calculator is free and needs no account or sign-up. Every calculation runs in your browser, so nothing you type is uploaded.
Can I print or share a calculation?
Yes. Print / save as PDF produces a one-page record with the inputs, results, calculation steps and date. Copy link copies a page address that stores every input, so the same calculation reopens later or can be sent to a colleague.
Can I use the results in a report or thesis?
Yes. Results may be used in any work, including commercial reports, theses and client projects, without attribution. Check that the method’s assumptions fit your data before you report them.
Why does my result differ from Excel?
Linear interpolation matches Excel’s PERCENTILE.INC, and the exclusive method matches PERCENTILE.EXC. Choose the method that matches the function you used. Nearest rank matches neither and returns an actual value from your data.
Can I enter a mean and standard deviation instead of data?
No. The tool needs the raw values. If you only have a mean and standard deviation, use the normal-distribution method described above.
What is the difference between a percentile and a percentile rank?
A percentile is a value from the data (the 90th percentile is the value below which about 90 % of the data fall). A percentile rank goes the other way: it tells you what percentage of the data lies below a value you choose.
Related tools
- Statistics calculator — when you want a broad set of summary statistics for one data set.
- Standard deviation calculator — when you need the spread of your data before using a mean and standard deviation method.
- Mean, median and mode calculator — when you want the centre of your data rather than a position within it.
- Box and whisker plot calculator — when you want to see quartiles and spread in a chart.
- Relative standard deviation calculator — when you want spread expressed as a percentage of the mean.
- Confidence interval calculator — when you need a range for the mean rather than a percentile.