Paired T Test Calculator
Paste two matched columns (or the differences) to test whether the mean change differs from zero, with every step shown.
Recent
Your last 10 settings, saved only in this browser. Nothing is uploaded.
How to use the Paired t-test calculator
- Choose how to enter your data: two columns (sample 1 before, sample 2 after), a list of differences, or a summary of the differences (mean d̄, SD s_d and number of pairs n).
- If you use two columns, type or paste the values in the same order so that each row is one pair. Commas, spaces, tabs and new lines all separate values, so you can paste a column straight from a spreadsheet.
- Open More options and set the hypothesized mean difference μ_d. It defaults to 0.
- Select the tail: two-tailed, right-tailed or left-tailed.
- Set α. It defaults to 0.05, and you can also type 5 %.
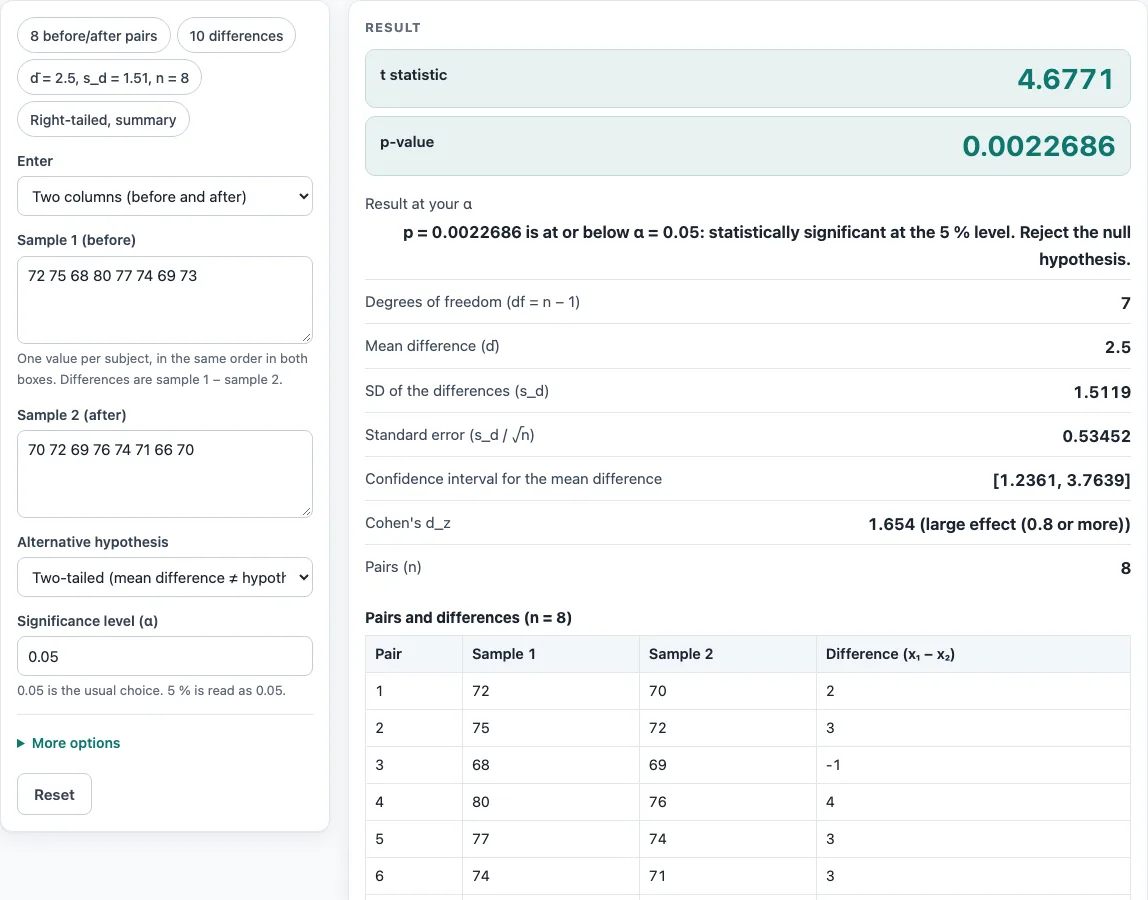
- Read the result. It shows the t statistic, p-value, decision at α, degrees of freedom, mean difference, SD of the differences, standard error, confidence interval and Cohen’s d_z. Open How it was calculated to see the formula, the values substituted and the answer.
- If the table appears, check each pair and its difference. It shows at most the first 50 rows.
To start from a ready-made case, use the preset buttons above the form. Reset restores the starting example. Copy result copies the result lines with a link, Copy link copies a page address that stores all your inputs, and Print / save as PDF produces a one-page record with the inputs, results, steps and date.
What is a paired t test?
A paired t test compares two measurements taken from the same subjects, or from matched pairs, to see whether the average change is different from a set value. Each pair is reduced to one number, the difference d = x₁ − x₂, so the problem becomes a one-sample t test on those differences. The test asks whether the mean of the differences, d̄, is far enough from the hypothesized value μ_d to be unlikely if the true mean difference were μ_d.
Pairing matters because it removes variation between subjects. A person who scores high before a test often scores high after it too, so looking at each person’s change gives a clearer signal than comparing two separate groups. The test assumes that the pairs are independent of each other and that the differences are roughly normally distributed. Check these assumptions against your data before you report the result.
How is the paired t statistic calculated?
The calculator uses three formulas. The standard error is SE = s_d / √n, where s_d is the standard deviation of the differences and n is the number of pairs. The t statistic is t = (d̄ − μ_d) / SE. The degrees of freedom are df = n − 1, and the p-value comes from the t distribution with that many degrees of freedom. This is the standard paired-samples t test formula used by statistics software, with each difference taken as first column minus second column.
Take the 8 before/after pairs on the page. The differences have d̄ = 2.5 and s_d = 1.5119, so SE = 1.5119 / √8 = 0.53452 and t = (2.5 − 0) / 0.53452 = 4.677. With df = 7, the two-tailed p-value is 0.0022686.
Cohen’s d_z = d̄ / s_d measures the size of the change in standard deviation units. Cohen’s 1988 benchmarks treat 0.2 as small, 0.5 as medium and 0.8 as large. Because d_z uses only the observed mean and SD, it does not change when you alter the hypothesized difference.
Worked examples
| Input | Result |
|---|---|
| n = 8 pairs, d̄ = 2.5, s_d = 1.512, Two-tailed (mean difference ≠ hypothesized) | t = 4.677, df = 7, p = 0.0022686, significant at α = 0.05 |
| n = 8 pairs, d̄ = 2.5, s_d = 1.512, Right-tailed (mean difference greater) | t = 4.677, df = 7, p = 0.0011343, significant at α = 0.05 |
| n = 10 pairs, d̄ = 0.92, s_d = 0.78, Two-tailed (mean difference ≠ hypothesized) | t = 3.73, df = 9, p = 0.0046994, significant at α = 0.05 |
| n = 16 pairs, d̄ = -4.8, s_d = 6.3, Left-tailed (mean difference less) | t = -3.048, df = 15, p = 0.0040715, significant at α = 0.01 |
Calculated by the tool above with these values.
Frequently asked questions
Is the calculator free, and is anything I type uploaded?
Yes, the calculator is free and has no account or sign-up. Everything is calculated in your browser, so the numbers you type are not uploaded.
Can I print or share a calculation?
Yes. Print / save as PDF creates a one-page record with your inputs, results, calculation steps and the date. Copy link copies an address that stores every input, so the same calculation reopens later or can be sent to a colleague.
What do the warnings mean?
The calculator warns you in three cases: a one-sided test whose result points the opposite way from your hypothesis (p above 0.5), a p-value within 2 % of α, and fewer than 3 degrees of freedom. A warning does not stop the calculation, but it means you should look at the result more carefully before you report it.
Why does the calculator show an error when every difference is the same?
If all the differences are identical, the standard deviation is 0. The t statistic divides by the standard error, which would then be 0, so t is undefined. The calculator also gives an error for fewer than 2 pairs, a negative SD, or non-numeric text in a list.
What happens if my two columns have different lengths?
The calculator warns you and uses only the first k pairs, where k is the length of the shorter column. Each column needs at least 2 values.
Does this calculator give power or sample size?
No. The outputs are the t statistic, p-value, decision, degrees of freedom, mean difference, standard deviation, standard error, confidence interval, Cohen’s d_z and number of pairs.
Related tools
- T test calculator: use it when your two groups are independent rather than paired.
- Z test calculator: use it when the population standard deviation is known.
- T test vs z test: read this to decide which of the two tests fits your data.
- P-value calculator: use it to convert a test statistic into a p-value on its own.
- Critical value calculator: use it to find the cutoff for your chosen α and tail.
- Confidence interval calculator: use it to build an interval for a mean from other inputs.
- Which statistical test to use: use it when you are not sure which test your design needs.
- Effect size calculator: use it to compare effect sizes across different measures.