P-Value Calculator
Enter a z, t, chi-square or F statistic and the degrees of freedom to get the p-value, the critical value and whether the result is significant.
Recent
Your last 10 settings, saved only in this browser. Nothing is uploaded.
The P-value calculator turns a test statistic into a p-value, the probability of a result at least as extreme as yours if the null hypothesis were true. Enter a z-score, t-score, chi-square or F statistic, choose the tail and your significance level α, and it tells you whether the result is statistically significant. It works as a statistical significance (stat sig) calculator — enter a statistic to determine the p-value — a t score calculator and a test statistic calculator in one page.
It runs in your browser, is free, and needs no sign-up. The result updates as you type. You get the p-value, a verdict at your α, the critical values and a chart of the distribution with the p-value area shaded.
How to use the P-value calculator
- Under “Test statistic type”, choose z-score, t-score, chi-square or F.
- Type the test statistic into the statistic field.
- Enter the degrees of freedom if your type needs them. t and chi-square need one value, F needs two (numerator df₁ and denominator df₂), and a z-score needs none.
- Pick the tail: two-tailed (the default), right-tailed or left-tailed.
- Check the significance level α. It starts at 0.05 and you can edit it. 0.05, 5 % and 5 all mean the same.
- Read the result: the p-value for your tail, the verdict at your α, the critical values, and the left-tail, right-tail and two-tailed probabilities.
- Look at the curve. The p-value area is shaded, and the observed statistic and the critical values are marked on it.
- Open “How it was calculated” to see the formula, the values substituted and the answer with units.
- Try a preset, such as z = 1.96 two-tailed or χ² = 7.815 with 3 degrees of freedom, to see a result that sits right at α = 0.05.
Preset buttons above the form load typical cases. Reset restores the starting example. Copy result copies the result lines with a link, Copy link copies the page address (which stores every input), and Print / save as PDF gives a one-page record with the inputs, results, steps and date.
How do you find or calculate a p-value in statistics (by hand)?
Start from the test statistic your test produced — z, t, χ² or F — and the distribution it follows under the null hypothesis. The p-value is the area of that distribution at least as far out as your statistic, in the direction(s) of the alternative hypothesis. By hand you would read it from a table, which only brackets it between two columns; the calculator computes the exact area.
How to find, get or calculate the p-value from a test statistic in a hypothesis test
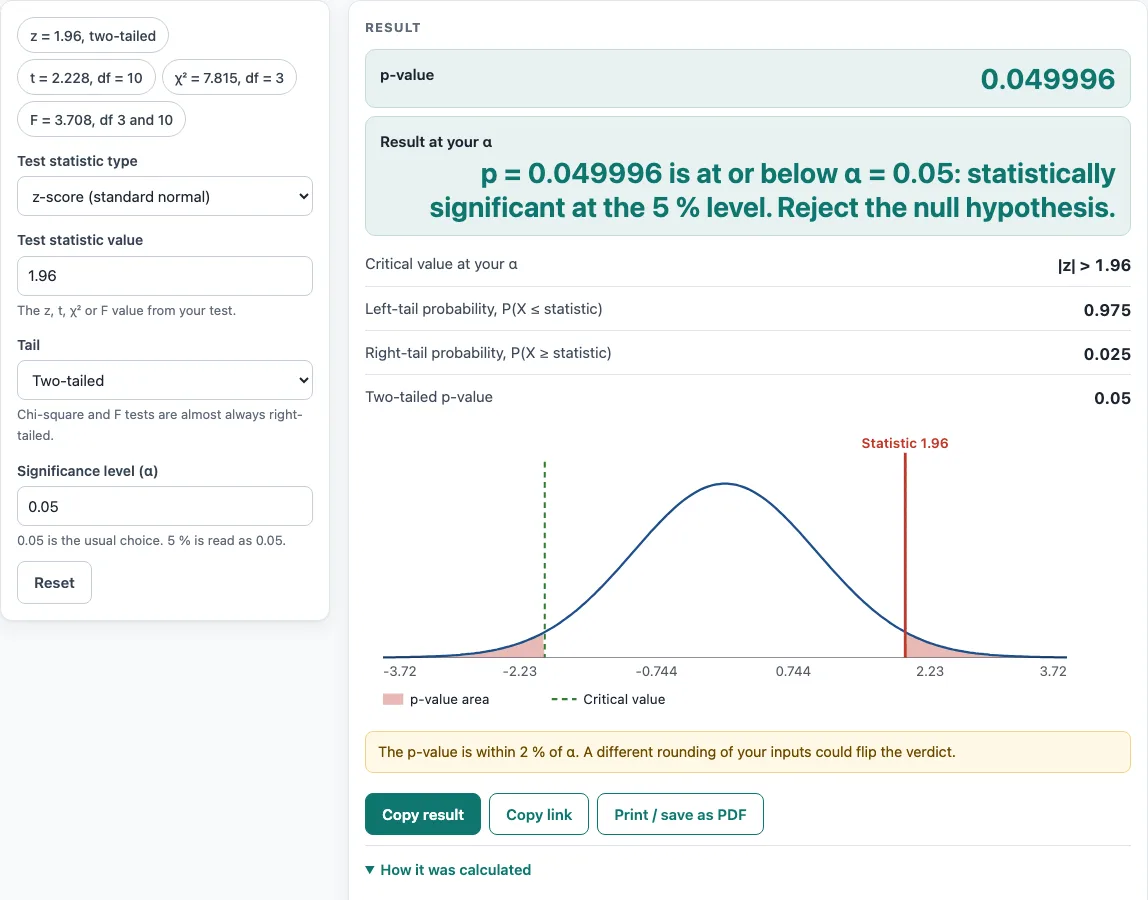
A z-score needs no degrees of freedom, so the p-value comes directly from the normal distribution. For a two-tailed test, the p-value is 2 × P(X ≥ |z|): find the probability of a value at least as large as the absolute value of z in one tail, then double it. For z = 1.96, this gives p = 0.049996.
For a right-tailed test, the p-value is P(X ≥ z), the area above your statistic. For a left-tailed test, it is P(X ≤ z), the area below. For example, z = -1.645 with a left tail gives p = 0.049985.
How to find or calculate the p-value from a t statistic (for a t test)
t-scores follow the same idea, using the Student t distribution with your degrees of freedom: n − 1 for a one-sample or paired t test, n₁ + n₂ − 2 for a pooled two-sample test, or the Welch value for unequal variances. With t = 2.228 and 10 degrees of freedom the two-tailed p-value is 0.050012.
How to find the p-value from a chi-square or F statistic
Chi-square and F distributions are not symmetric, so for those the two-tailed p-value is 2 × the smaller tail, capped at 1. These tests are normally right-tailed, which is why the calculator warns about left or two-tailed chi-square and F tests.
What is a one-tailed or two-tailed test, and how do you find the p-value of each?
A one-tailed (right or left) test looks for an effect in one stated direction, so the p-value is the area in that tail only. A two-tailed test looks for a difference in either direction, so for z and t the p-value is twice the one-tail area beyond |statistic|. Choose the tail before you look at the data.
What is the critical value for α = 0.05 (one-tailed vs two-tailed)?
The critical value is the statistic where the rejection region begins. At α = 0.05, a right-tailed z test rejects when z > 1.645. A left-tailed test rejects when z < -1.645. A two-tailed test splits α between both ends, so it rejects when |z| > 1.960.
Critical values for t depend on degrees of freedom. With t = 2.228 and 10 degrees of freedom, the two-tailed critical value is |t| > 2.2281. The statistic falls just short of it, and its two-tailed p-value is 0.050012, which is above 0.05, so the result is not significant.
For chi-square with 3 degrees of freedom, the right-tailed critical value at 0.05 is χ² > 7.8147. A statistic of 7.815 gives p = 0.049994, which is just significant.
Sources
- NIST/SEMATECH e-Handbook critical value tables used to check the results: normal, t, F and chi-square
- Distribution functions computed with the regularized incomplete beta and gamma functions (standard numerical methods)
Worked examples
| Input | Result |
|---|---|
| z = 1.96, Two-tailed | p = 0.049996, significant at α = 0.05 |
| t = 2.228 (df 10), Two-tailed | p = 0.050012, not significant at α = 0.05 |
| z = -1.645, Left-tailed | p = 0.049985, significant at α = 0.05 |
| χ² = 7.815 (df 3), Right-tailed | p = 0.049994, significant at α = 0.05 |
| F = 3.708 (df 3, 10), Right-tailed | p = 0.050009, not significant at α = 0.05 |
| t = 2.2694 (df 15.5), Right-tailed | p = 0.018955, significant at α = 0.05 |
Calculated by the tool above with these values.
Frequently asked questions
How do I get a p-value from a t-score and degrees of freedom?
Choose t-score, type the statistic and enter one degrees-of-freedom value. The calculator uses the Student t distribution with that many degrees of freedom. For example, t = 2.2694 with 15.5 degrees of freedom (a Welch test) gives a right-tailed p-value of 0.018955.
Is my result statistically significant?
It is significant when p ≤ α, and the verdict under the result states this at your chosen α. With α = 0.05, z = 1.96 two-tailed (p = 0.049996) is significant, while t = 2.228 with 10 degrees of freedom (p = 0.050012) is not. A p-value within 2 percent of α triggers a warning, so treat results that close to the line with extra care.
What is hypothesis testing in statistics, and what is the p-value in hypothesis testing?
Hypothesis testing compares data with a null hypothesis (usually “no effect” or “no difference”). The p-value in hypothesis testing measures how surprising your test statistic would be if the null hypothesis were true; a p-value at or below α leads you to reject it.
How do you calculate the p-value in hypothesis testing?
Compute the test statistic, pick the matching distribution and degrees of freedom, choose the tail from your alternative hypothesis, and find the tail area. Enter those three things here and the calculator gives the p-value and the verdict.
What is the level of significance (α)?
The level of significance α is the p-value cutoff you set before testing, usually 0.05. It is the chance of rejecting a true null hypothesis that you are willing to accept.
What does a p-value actually mean?
It is the probability of a test statistic at least as extreme as yours, for the tail you chose, assuming the null hypothesis is true. It is not the probability that the null hypothesis is true, and the calculation steps repeat this. A small p-value means your data would be unusual under the null hypothesis, not that the effect is large or important.
Is the calculator free, and is anything I type uploaded?
The calculator is free and needs no account or sign-up. Everything is calculated in your browser, and nothing you type is uploaded.
Can I print or share a calculation?
Yes, in two ways. Print / save as PDF creates a one-page record with the inputs, results, calculation steps and date. Copy link stores every input in the page address, so the same calculation reopens later or can be sent to a colleague.
Related tools
- T test calculator — compare a mean with a value or two means
- Paired t test calculator — before/after and matched-pair data
- Z test calculator — means with known σ and proportions
- T test vs z test — which of the two tests applies
- Critical value calculator — the cutoff for a chosen α and tail
- Confidence interval calculator — a range for a mean, a proportion or a difference
- Which statistical test to use — find the right test for your data
- Effect size calculator — Cohen’s d, Hedges’ g and conversions
- Correlation coefficient calculator — Pearson r with p-value and CI