Odds Ratio Calculator
Enter the four counts of a 2×2 table to get the odds ratio with its confidence interval, relative risk, risk difference and p-values.
Recent
Your last 10 settings, saved only in this browser. Nothing is uploaded.
The odds ratio calculator works out the odds ratio for a 2 × 2 table of counts, together with its 95 % confidence interval. It also gives the relative risk, the risk difference, the number needed to treat or harm, and two p-values, so you can compare an exposed group with an unexposed group in one place. It runs in your browser, is free, and needs no sign-up.
You enter four counts, labelled a, b, c and d, and the result updates as you type. A table of your counts, with row and column totals and the risk in each group, appears with the results. The calculator reports risks and relative risk only where your study design allows them, as explained below.
How to use the Odds ratio calculator
- Arrange your counts in a 2 × 2 table. Rows are exposed and unexposed; columns are event and no-event.
- Type each count into the matching box: a (exposed, event), b (exposed, no event), c (unexposed, event) and d (unexposed, no event).
- Counts must be whole numbers of zero or more, and no row or column may add up to zero.
- To paste from a spreadsheet, copy the numbers and paste them in. Commas, spaces, tabs and new lines all work as separators.
- Read the results as you type. Start with the odds ratio and its interval, then the relative risk, risk difference and number needed to treat or harm, if shown.
- Check any warnings. They appear for a zero cell, an expected count below 5, a risk above 10 %, a hidden number needed, or a total under 20 people.
- Open More options to change the confidence level from the default 95 %.
- Open “How it was calculated” under the result to see the formula, the values substituted and the answer.
- Press a preset button above the form to load a typical case, or press Reset to return to the starting example.
Copy result copies the result lines with a link. Copy link copies the page address, which stores every input, so the same calculation reopens later. Print / save as PDF prints a one-page record with your inputs, results, steps and the date.
How is the odds ratio and its confidence interval calculated?
The odds ratio is (a × d) / (b × c), the cross-product of the 2 × 2 table. It compares the odds of the event in the exposed group with the odds in the unexposed group. A value of 1 means the odds are equal.
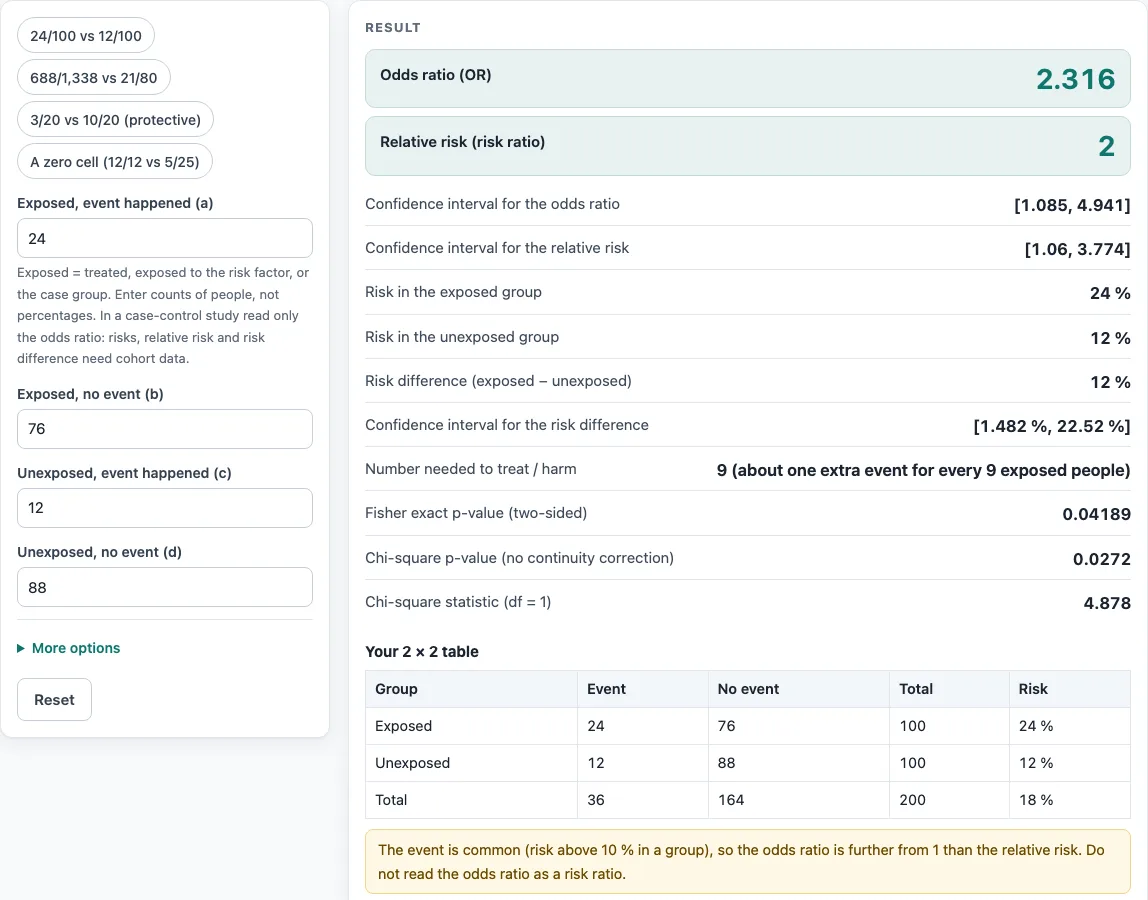
The confidence interval uses Woolf’s method (1955). The standard error of the log odds ratio is √(1/a + 1/b + 1/c + 1/d), and the interval is exp(ln OR ± z × SE). At 95 % the z value is 1.96. For the worked table a = 24, b = 76, c = 12, d = 88, the odds ratio is 2.316 with a 95 % interval of 1.085 to 4.941.
When any cell is 0, the calculator adds 0.5 to every cell before computing the odds ratio, the relative risk and their intervals. This is the Haldane–Anscombe correction (Haldane 1956; Anscombe 1956). The risk difference, chi-square and Fisher test use the raw counts.
When is an odds ratio enough, and when do you need relative risk or risk difference?
An odds ratio is valid for a case-control study. Risks, relative risk and risk difference need cohort or trial data, because a case-control design does not measure risk in each group.
Relative risk is [a / (a + b)] / [c / (c + d)]. Its interval uses the Katz method (Katz et al. 1978; Agresti 2013). The risk difference is the risk in the exposed group minus the risk in the unexposed group, in percentage points, with a Wald interval clipped to ±100 percentage points.
The number needed to treat (or harm) is 1 / |risk difference|, rounded up (Altman 1998). It is shown only when the interval of the risk difference excludes 0. It is a number needed to harm when the exposed group has more events.
Two p-values are given. Fisher’s exact test is two-sided and suits small counts. The Pearson chi-square test without continuity correction uses df = 1. For the worked table, the Fisher p-value is 0.04189, and the chi-square statistic is 4.878 with p = 0.0272.
Worked examples
| Input | Result |
|---|---|
| a = 24, b = 76, c = 12, d = 88 | OR = 2.316 [1.085, 4.941], RR = 2 |
| a = 688, b = 650, c = 21, d = 59 | OR = 2.974 [1.787, 4.949], RR = 1.959 |
| a = 3, b = 17, c = 10, d = 10 | OR = 0.1765 [0.03905, 0.7974], RR = 0.3 |
| a = 12, b = 0, c = 5, d = 20 | OR = 93.18 [4.736, 1,833], RR = 4.545 |
| a = 1200, b = 8800, c = 900, d = 9100 | OR = 1.379 [1.259, 1.511], RR = 1.333 |
Calculated by the tool above with these values.
Frequently asked questions
Is the calculator free, and is anything I type uploaded?
Yes, the calculator is free, and there is no account or sign-up. Everything is calculated in your browser, so nothing you type is uploaded.
Can I print or share a calculation?
Yes. Print / save as PDF produces a one-page record with the inputs, results, calculation steps and date. Copy link copies a page address that stores every input in the ?s= part of the URL, so the calculation can be reopened later or sent to a colleague.
Can I use the results in a report or thesis?
Yes. Results may be used in any work, including commercial reports, theses and client projects, without attribution. Check that the method’s assumptions fit your data before you report them.
What does an odds ratio of 1 mean?
An odds ratio of 1 means the odds of the event are the same in both groups. Values above 1 mean higher odds in the exposed group, and values below 1 mean lower odds. The example a = 3, b = 17, c = 10, d = 10 gives 0.1765, so the exposed group has lower odds.
Why does the calculator add 0.5 to my counts?
Division by a zero cell is not possible, so when any cell is 0 the calculator adds 0.5 to every cell before computing the odds ratio and relative risk. A warning tells you when this happens. The risk difference, chi-square and Fisher test still use your raw counts.
What do the warnings mean?
Each warning flags a result that may need a different method or more data. A zero cell and an expected count below 5 both mean the Fisher p-value is the safer guide. A risk above 10 % means the odds ratio overstates the risk ratio, and a total under 20 people means the results are fragile.
Related tools
- Sample size calculator: use it before a study to estimate how many participants you need.
- Power analysis calculator: use it to check the chance your study will detect an effect of a given size.
- Effect size calculator: use it to express the size of a difference in a form that is independent of sample size.
- Confidence interval calculator: use it for intervals around a mean or proportion rather than an odds ratio.
- Chi-square test calculator: use it to test independence in a table with more than two rows or columns.
- T test calculator: use it to compare the means of two groups instead of counts in a table.