Multiple Regression Calculator
Paste a table with a header row, choose the response column and get the fitted equation, coefficient tests, R² and VIF.
Recent
Your last 10 settings, saved only in this browser. Nothing is uploaded.
How to use the multiple regression calculator
- Paste your table into the data box. Put the column names in the first row and one observation per row below. Columns copied from a spreadsheet paste straight in.
- Check the header. If the first row has no names, the calculator names the columns x1, x2, … , treats the last column as y, and shows a warning.
- Choose the response column by typing its name or its number (1 is the first column). Leave it empty to use the last column. Every other column becomes a predictor.
- Set the confidence level for the intervals if you need something other than the 95 % default. You can choose any value from 50 % to 99.9 %.
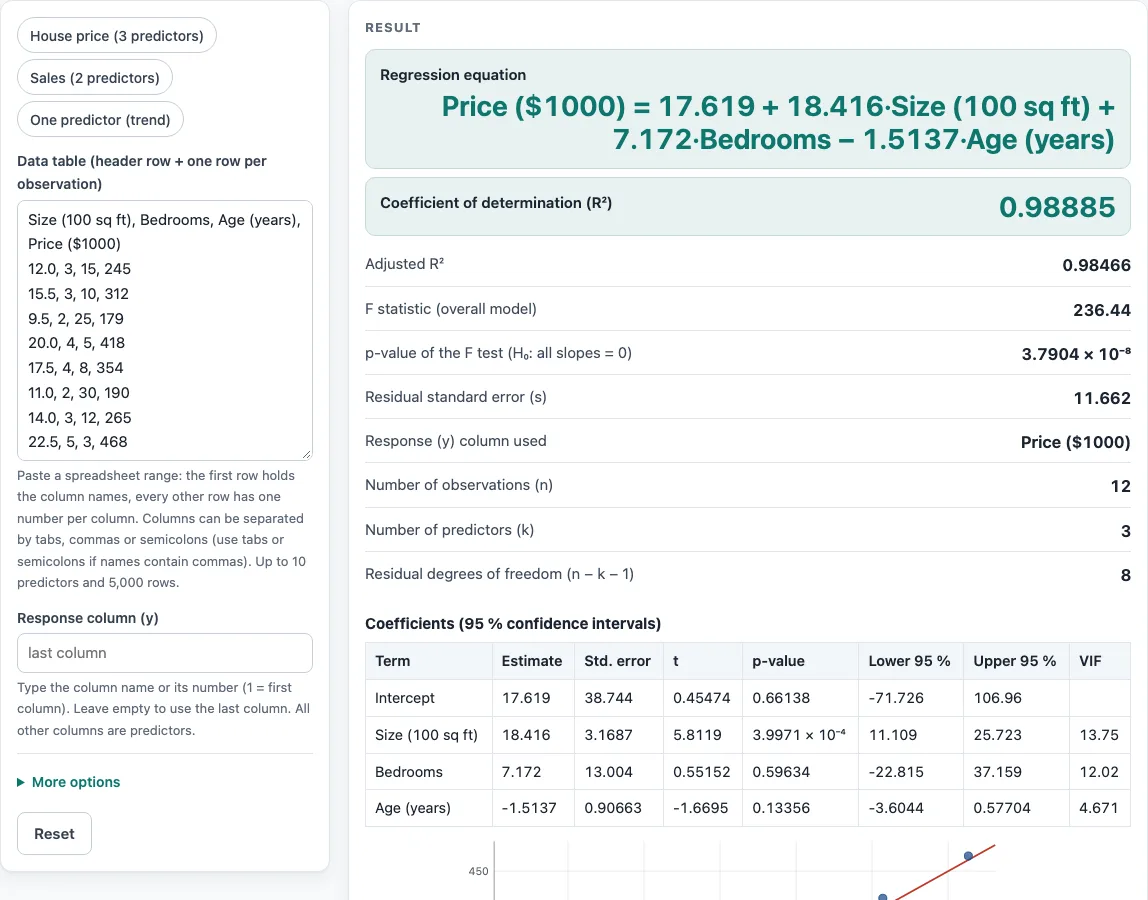
- Read the regression equation and the model results: R², adjusted R², the F statistic with its p-value, and the residual standard error.
- Check the coefficient table. Each row shows the estimate, standard error, t statistic, p-value and confidence interval, plus the VIF when there are two or more predictors.
- Look at the plot of observed against fitted values for curvature or outliers. Open ‘How it was calculated’ to see the formula, the values substituted and the answer.
Preset buttons above the form load typical cases: house price with three predictors, sales with two, and a one-predictor year trend. ‘Copy result’ copies the result lines with a link. ‘Copy link’ stores your inputs in the page address, ‘Print / save as PDF’ prints a one-page record, and ‘Reset’ restores the starting example.
What does a multiple regression model look like?
A multiple regression model predicts one response y from several predictors x₁ to x_k, using y = β₀ + β₁x₁ + … + β_k x_k. Each β is the expected change in y for a one-unit increase in its predictor while the other predictors stay fixed. The calculator fits this by ordinary least squares, which chooses the coefficients that make the sum of squared residuals as small as possible, and it always includes an intercept β₀.
How does the calculator find the coefficients accurately?
It builds the design matrix, a column of ones plus the predictors, and solves it with Householder QR decomposition instead of inverting XᵀX. This keeps results accurate when the data have a large offset, such as years 2000 to 2011. If one predictor is an exact combination of earlier ones, the fit is impossible, and the calculator reports an error that names that predictor.
How do you read the p-value and confidence interval for a predictor?
The t statistic is the estimate divided by its standard error, and the two-tailed p-value uses n − k − 1 degrees of freedom. A small p-value means the coefficient is unlikely to be zero once the other predictors are included. The confidence interval is estimate ± t × SE. If it contains zero, the coefficient is not significant at that confidence level.
What do R², adjusted R² and the F test tell you?
R² is the share of the variation in y that the predictors explain. Adjusted R² is 1 − (1 − R²)(n − 1)/(n − k − 1), which penalises extra predictors, so it can fall when a weak predictor is added. The overall F test checks whether the predictors together explain more variation than chance would, using (k, n − k − 1) degrees of freedom.
What does the variance inflation factor (VIF) show?
The VIF for predictor j is 1/(1 − R²ⱼ), where R²ⱼ comes from regressing that predictor on the others. A VIF above 10 signals strong multicollinearity, meaning the predictor overlaps heavily with the others and its coefficient becomes unstable. In the default house example, Size and Bedrooms have VIFs of 13.75 and 12.02, which triggers that warning.
Which assumptions must hold for the p-values?
P-values and confidence intervals assume a linear model whose residuals are independent, roughly normal and have constant spread. The calculator reminds you of this, and the plot helps you spot curvature and outliers. Check these assumptions before you report the results.
Worked examples
| Input | Result |
|---|---|
| 12 rows, 3 predictors | R² = 0.9888, adjusted R² = 0.9847, F-test p = 3.7904 × 10⁻⁸ |
| 7 rows, 2 predictors | R² = 0.9975, adjusted R² = 0.9962, F-test p = 6.4451 × 10⁻⁶ |
| 12 rows, 1 predictors | R² = 0.9715, adjusted R² = 0.9687, F-test p = 4.6828 × 10⁻⁹ |
| 7 rows, 2 predictors | R² = 0.9975, adjusted R² = 0.9963, F-test p = 6.1127 × 10⁻⁶ |
Calculated by the tool above with these values.
Frequently asked questions
Is the multiple regression calculator free, and is anything I type uploaded?
Yes, it is free, and there is no account or sign-up. Everything is calculated in your browser, so nothing you type is uploaded.
Can I print or share a calculation?
Yes. ‘Print / save as PDF’ produces a one-page record with the inputs, results, calculation steps and date. ‘Copy link’ copies a page address that stores every input, so the same calculation reopens later or can be sent to a colleague.
How many predictor variables can I use?
You can use up to 10 predictors and 5,000 rows, so a multiple regression calculator for 4 predictor variables works directly. You need at least k + 2 rows, which is 6 rows for 4 predictors, but fewer than 10 observations per predictor triggers a warning.
Can I use the calculator if my table has no header row?
Yes. Without a header row, the calculator names the columns x1, x2, … , uses the last column as y, and shows a warning so you can check the result.
Why did I get a multicollinearity warning?
The warning appears when a predictor’s VIF is above 10, which means the other predictors explain it closely. Try removing one of the overlapping predictors and recalculating to see whether the remaining coefficients become more stable.
Related tools
- Linear regression calculator: use it when you have a single predictor and want the simple fit first.
- Correlation coefficient calculator: use it to measure the straight-line relationship between two variables before you build a model.
- Spearman rank correlation calculator: use it when your data are ranks or the relationship is monotonic rather than linear.
- P-value calculator: use it to convert a test statistic into a p-value.
- Which statistical test to use: use it when you are not sure whether regression fits your question.
- Statistics calculator: use it to find other statistics tools in one place.