Linear Regression Calculator
Paste x, y pairs to get the least squares regression line ŷ = a + b·x, R², tests for slope and intercept and a prediction.
Recent
Your last 10 settings, saved only in this browser. Nothing is uploaded.
A linear regression calculator fits the straight line of best fit through paired x and y data and reports its equation, ŷ = a + b·x, along with R². It runs in your browser, is free, and needs no sign-up.
You can enter data as one “x, y” pair per line or as two lists, then read the slope, intercept and fit statistics. The calculator also gives standard errors, t statistics, p-values and confidence intervals for the slope and intercept, plus an optional prediction for any x value you choose. It needs at least three pairs of data, and a scatter plot shows the points and the fitted least squares regression line. Use it as a regression calculator for coursework or as a quick linear regression analysis solver before you write a report.
How to use the Linear regression calculator
- Paste your data into the input box. Use one “x, y” pair per line, or write two lists on lines starting with “x:” and “y:”. Commas, spaces, tabs, semicolons and new lines all work, so you can copy a column straight from a spreadsheet.
- Optionally, add a first line with two column names, such as “Hours, Score”. The names label the scatter plot.
- Enter at least 3 pairs. The result updates as you type.
- Read the regression equation ŷ = a + b·x and R² in the primary results.
- Check the slope and intercept sections for the standard error, t statistic, p-value and confidence interval of each.
- Type an x value in the prediction box to get ŷ, a confidence interval for the mean response and a prediction interval for one new observation. Leave it empty to skip this step.
- Open More options to change the confidence level from 50 to 99.9 %. The default is 95 %.
- Open “How it was calculated” under the result to see the formula, the substituted values and the answer.
- Review the residual table and scatter plot for outliers or curved patterns.
The preset buttons above the form load four typical cases: hours studied and score, height and weight, advertising and sales, and car age and price. Reset restores the starting example.
What is regression?
Regression describes how one variable, y, changes as another variable, x, changes, and uses that description to predict y. Linear regression assumes the relationship is a straight line, written ŷ = a + b·x. The slope b is the change in y for each one-unit increase in x, and the intercept a is the predicted y when x is 0.
The “least squares” part means the line is chosen so that the sum of squared residuals is as small as possible. Each residual is the observed value minus the fitted value, y − ŷ. Squaring stops positive and negative residuals from cancelling out, and it gives one unique best line for any set of data with varying x values.
How does the least-squares line get its slope and intercept?
The slope is b = Sxy / Sxx, where Sxx is the sum of (x − x̄)² and Sxy is the sum of (x − x̄)(y − ȳ). The intercept then follows from a = ȳ − b·x̄, so the line always passes through the point made by the two means.
R² is the share of the variation in y that the line explains. It is calculated as 1 − SSE/SST, where SSE is the sum of squared residuals and SST is the total variation in y. Values near 1 mean the points sit close to the line. Values near 0 mean x tells you little about y.
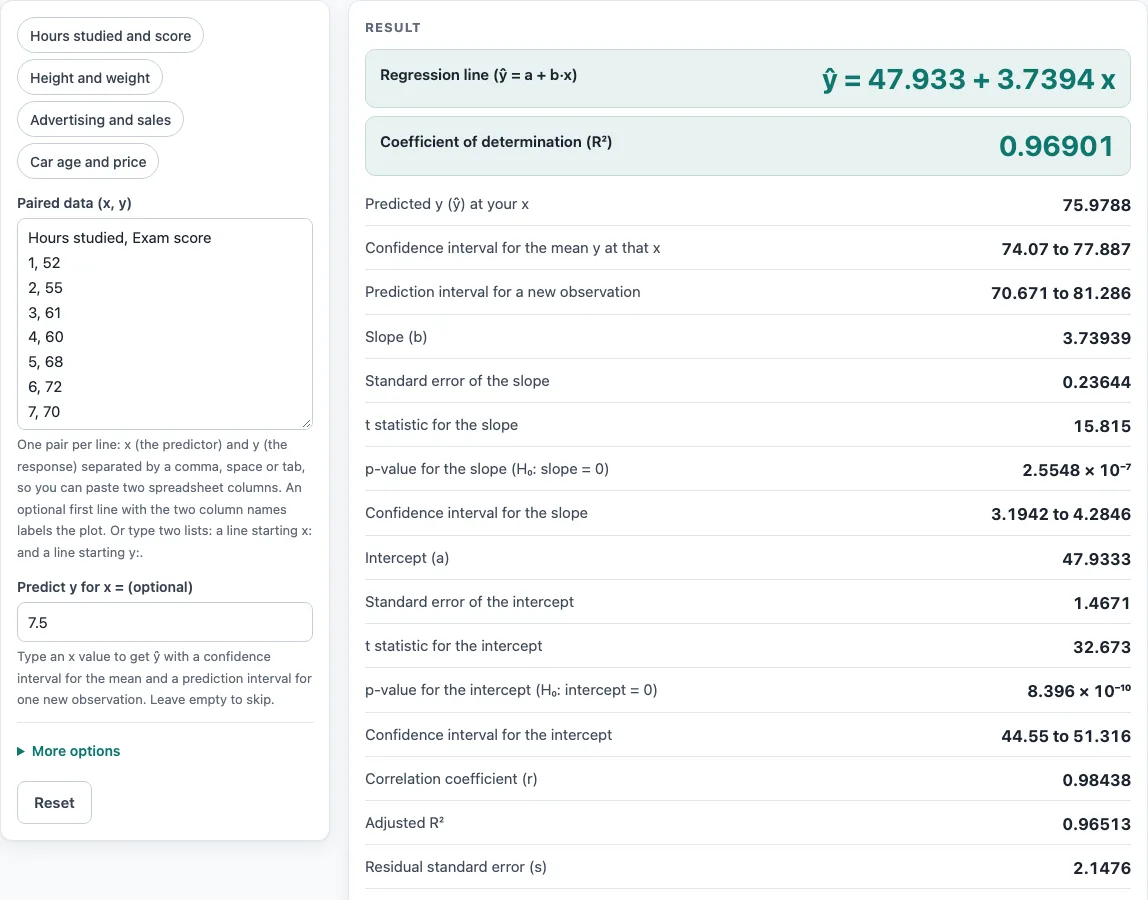
Uncertainty comes from the residual standard error, s = √(SSE/(n − 2)). The standard error of the slope is SE(b) = s/√Sxx. Each t statistic divides the estimate by its standard error, using n − 2 degrees of freedom, and each confidence interval is estimate ± t × SE. In the default example of hours studied and exam score, the slope is 3.7394 with a 95 % interval of 3.1942 to 4.2846.
Worked examples
| Input | Result |
|---|---|
| 10 (x, y) pairs | ŷ = 47.933 + 3.7394 x, R² = 0.969 |
| 10 (x, y) pairs | ŷ = -79.869 + 0.87556 x, R² = 0.9628 |
| 7 (x, y) pairs | ŷ = 5.7143 + 2.8929 x, R² = 0.9787 |
| 6 (x, y) pairs | ŷ = 23.899 − 1.8077 x, R² = 0.9964 |
Calculated by the tool above with these values.
Frequently asked questions
Is the calculator free, and is anything I type uploaded?
Yes, it is free, and there is no account or sign-up. Everything is calculated in your browser, so nothing you type is uploaded. Results may be used in any work, including commercial reports, theses and client projects, without attribution.
Can I print or share a calculation?
Yes. “Print / save as PDF” produces a one-page record with the inputs, results, calculation steps and the date. “Copy link” copies a page address that stores every input, so the same calculation reopens later or can be sent to a colleague.
How many data points do I need?
You need at least 3 pairs. With fewer than 10 pairs, the calculator shows a warning, because the standard errors and p-values rest on a small sample.
Why does the calculator show an error?
If all x values are equal, no line can be fitted. If all y values are equal, R² is undefined. Both cases produce an error message.
What is the difference between a confidence interval and a prediction interval?
The confidence interval for the mean response covers the average y at a given x. The prediction interval is wider and covers a single new observation. If you predict at an x outside your data range, the calculator warns you that the result is an extrapolation.
Can I force the line through zero?
No. Regression through the origin is not offered, so the intercept is always estimated from the data.
Related tools
- Correlation coefficient calculator: use it to measure how strongly two variables move together before fitting a line.
- Spearman rank correlation calculator: use it when your data are ranked or the relationship is not linear.
- Multiple regression calculator: use it when you have more than one predictor variable.
- P-value calculator: use it to convert a test statistic into a p-value.
- Which statistical test to use: use it to choose a suitable test for your data.
- Statistics calculator: use it to browse the other statistics tools on the site.