Effect Size Calculator (Cohen's d)
Enter two groups' means, SDs and sizes, or a t statistic, to get Cohen's d, Hedges' g and Glass's Δ with a confidence interval.
Recent
Your last 10 settings, saved only in this browser. Nothing is uploaded.
How to use the Effect size calculator
- Open the page. To start from a typical case, press one of the preset buttons above the form: the two-group example, 5.8 versus 5.2 with 40 per group, a t statistic of 2.5 with 20 and 20, or converting d = 0.5.
- Choose your starting point: two groups’ means, standard deviations and sizes; a t statistic with the two group sizes; or a single effect size (d, r, η² or odds ratio) to convert.
- Type your values into the fields. For two groups, enter M, SD and n for each group.
- Read the result. It updates as you type and shows d, g, r, η², the odds ratio, the 95 % confidence interval and a size label. Glass’s Δ appears only in the two-group mode.
- Open “How it was calculated” under the result to see the formula, the values substituted and the answer.
- If you need a different confidence level, open More options and change it there.
Press Reset to return to the starting example.
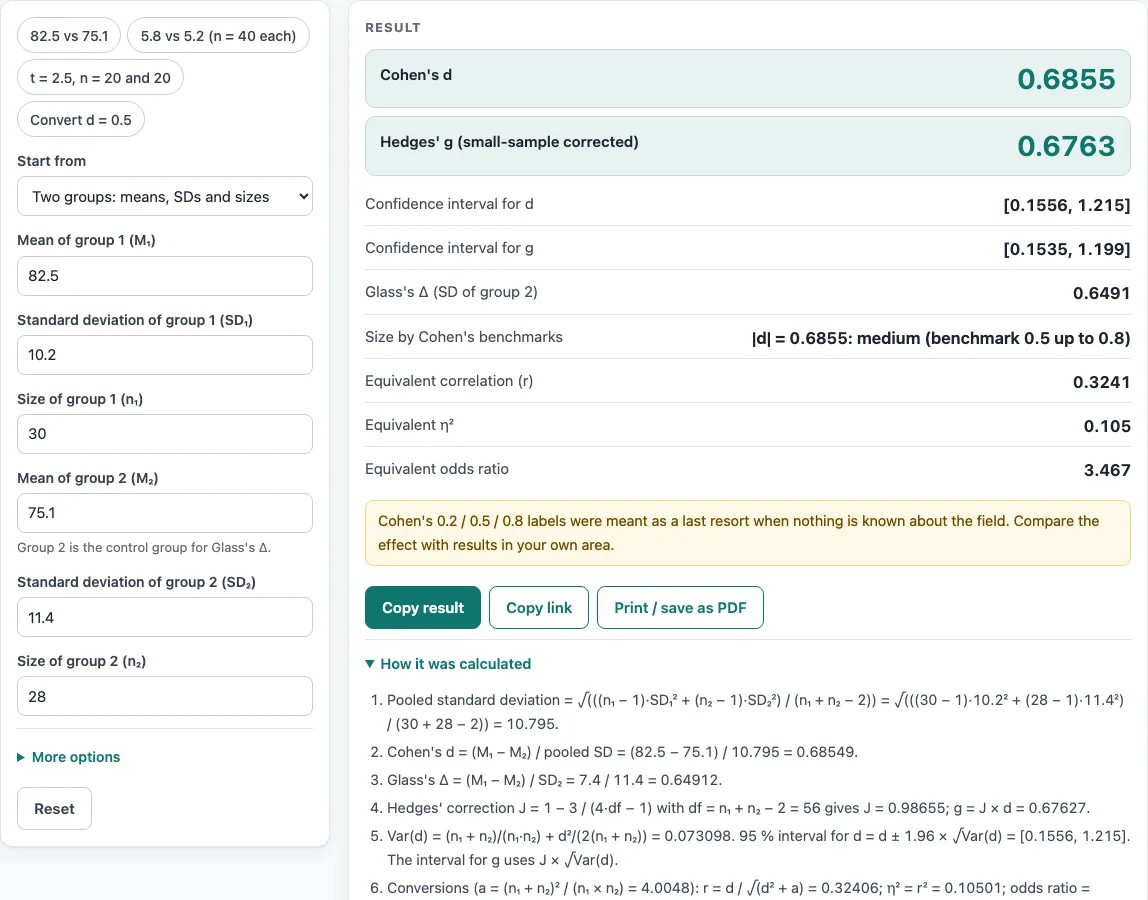
Example: group 1 has M = 82.5, SD = 10.2, n = 30 and group 2 has M = 75.1, SD = 11.4, n = 28. The calculator gives a pooled SD of 10.795, Cohen’s d = 0.6855 (medium), Hedges’ g = 0.6763 and a 95 % interval for d of 0.1556 to 1.215. Copy result, Copy link and Print / save as PDF save or share the calculation.
How is Cohen’s d calculated?
Cohen’s d is the difference between two group means divided by their pooled standard deviation, so the gap is expressed in standard-deviation units. The pooled SD weights each group’s variance by its degrees of freedom: √(((n₁ − 1)SD₁² + (n₂ − 1)SD₂²) / (n₁ + n₂ − 2)).
Hedges’ g multiplies d by the correction J = 1 − 3 / (4 × df − 1), where df = n₁ + n₂ − 2. Small samples make d slightly too large, and J removes that small-sample bias, so g is the safer figure when groups are small. Glass’s Δ divides the difference by the standard deviation of group 2 alone, which is treated as the control group. It suits studies where the control group’s spread is the natural yardstick.
If you only have a t statistic from an independent-samples test with pooled variance, the calculator uses d = t × √((n₁ + n₂) / (n₁ × n₂)).
The 95 % confidence interval for d is a normal approximation: d ± z × √Var(d), where Var(d) = (n₁ + n₂)/(n₁n₂) + d² / (2(n₁ + n₂)), following Hedges and Olkin (1985). For g, the same width is multiplied by J. The level can be changed under More options.
Every mode also reports the equivalent correlation r = d / √(d² + a), where a = (n₁ + n₂)² / (n₁n₂). It then gives η² = r² and the odds ratio exp(d × π / √3), as described in Borenstein, Hedges, Higgins and Rothstein (2009), chapter 7.
What do the size labels mean?
The label follows Cohen (1988). Below 0.2 is under the small benchmark, 0.2 to 0.5 is small, 0.5 to 0.8 is medium, and 0.8 or above is large. These are rough anchors only. A small effect can matter a great deal in medicine or education, so compare your value with results reported in your own field.
In the worked example, group 1 has M = 82.5, SD = 10.2, n = 30 and group 2 has M = 75.1, SD = 11.4, n = 28. This gives a pooled SD of 10.795 and d = 0.6855, which falls in the medium band. Hedges’ g is 0.6763, and the 95 % confidence interval for d is [0.1556, 1.215]. The interval is wide, which shows that the estimate is imprecise with groups of this size.
Worked examples
| Input | Result |
|---|---|
| Group 1: M = 82.5, SD = 10.2, n = 30; group 2: M = 75.1, SD = 11.4, n = 28 | d = 0.6855, g = 0.6763 |
| Group 1: M = 5.8, SD = 1.2, n = 40; group 2: M = 5.2, SD = 1.3, n = 40 | d = 0.4796, g = 0.475 |
| t = 2.5, n₁ = 20, n₂ = 20 | d = 0.7906, g = 0.7749 |
| Cohen's d = 0.8 | d = 0.8, r = 0.3714 |
| Correlation (r) = 0.3 | d = 0.629, r = 0.3 |
Calculated by the tool above with these values.
Frequently asked questions
Is the calculator free, and is anything I type uploaded?
Yes, it is free, and there is no account or sign-up. Everything is calculated in your browser, and nothing you type is uploaded. Results may be used in any work, including commercial reports, theses and client projects, without attribution.
Can I print or share a calculation?
Yes. Print / save as PDF creates a one-page record with the inputs, results, calculation steps and date. Copy link copies the page address, which stores every input in the ?s= part of the URL, so the same calculation reopens later or can be sent to a colleague. Copy result copies the result lines with a link.
Can I use this as an ANOVA effect size calculator?
Not directly. The calculator accepts two groups’ means and standard deviations, a t statistic with two group sizes, or a single effect size to convert. It does not take ANOVA sums of squares or F values. Enter any comparison you need as two groups.
What do the warnings under my result mean?
Warnings appear when the two standard deviations differ by more than a factor of 2, when the total sample is under 40, or when group sizes differ by more than a factor of 3. They also appear in convert mode for the equal-size assumption, and for the pooled-variance assumption of the t-statistic mode. Read each message and check that the method fits your data before you report the result.
Which input values does the calculator reject?
Group sizes must be whole numbers of at least 2, and standard deviations must be positive. r must lie strictly between −1 and 1, η² between 0 and 1, and the odds ratio must be positive.
Related tools
- T test calculator: use it to run the t test whose statistic you can convert into an effect size here.
- Paired t test calculator: use it when your two sets of scores come from the same people or matched pairs.
- Z test calculator: use it when you have a z statistic or know the population standard deviation.
- T test vs z test: read this to decide which of the two tests suits your data.
- P-value calculator: use it to find the p-value that goes with a test statistic.
- Critical value calculator: use it to find the cut-off a test statistic must pass.
- Confidence interval calculator: use it to build intervals for means or proportions beyond the effect size interval shown here.
- Which statistical test to use: read this if you are not sure which test matches your question.
- Sample size calculator: use it to plan how many participants each group needs before collecting data.