Critical Value Calculator
Choose z, t, chi-square or F, the significance level and the tail to get the critical value and the rejection region.
Recent
Your last 10 settings, saved only in this browser. Nothing is uploaded.
How to use the critical value calculator
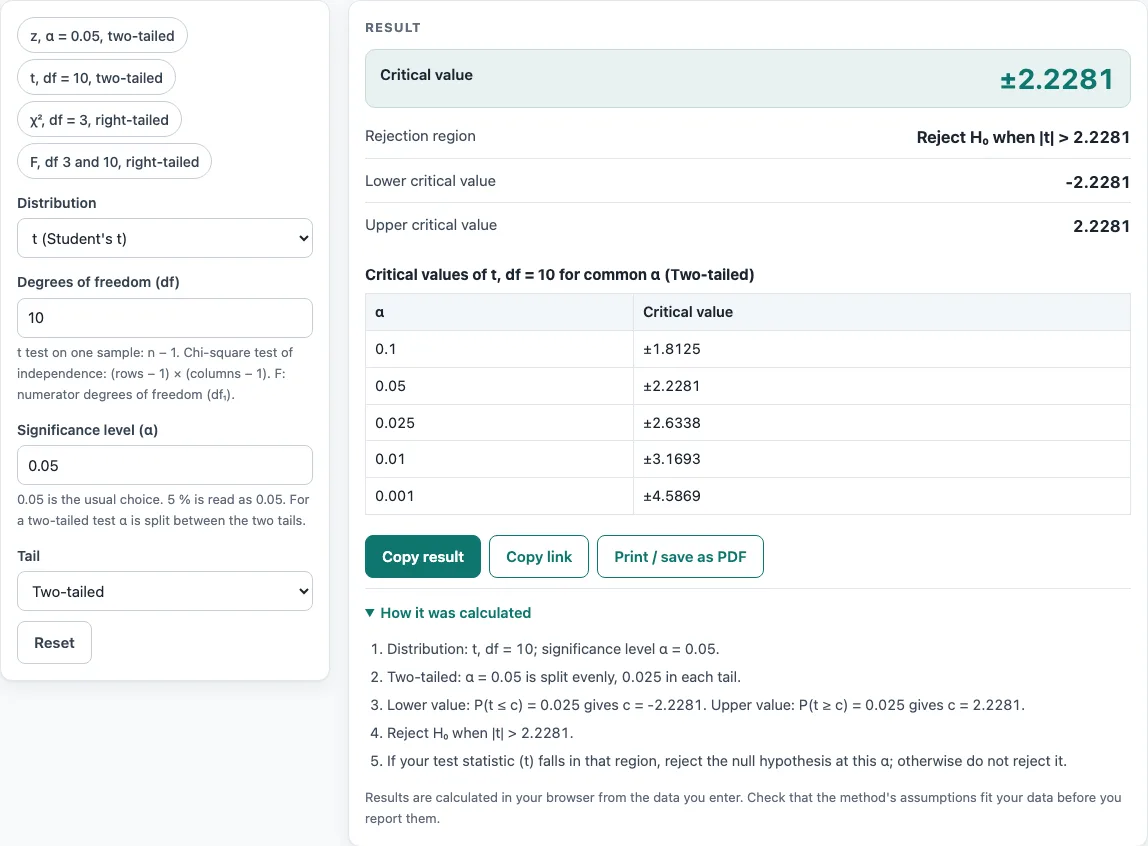
- Choose the distribution: z, Student t, chi-square or F. The preset buttons above the form load typical cases: z two-tailed at 0.05, t with df 10, chi-square with df 3 right-tailed, and F with df 3 and 10 right-tailed.
- Enter the degrees of freedom. Leave it empty for z, enter one value for t or chi-square, and enter two for F: the numerator df₁ and the denominator df₂. Values must be at least 1 and may be non-integer, as from a Welch t test.
- Enter α as 0.05 or as 5 %. It must be between 0 and 1.
- Pick the tail: two-tailed, right-tailed or left-tailed.
- Read the big critical value, then the rejection region written in words, then the lower and upper values as numbers. The table below shows critical values for α = 0.10, 0.05, 0.025, 0.01 and 0.001. To check the working, open “How it was calculated” under the result, which shows the formula, the values substituted and the answer.
Reset restores the starting example. Copy result copies the result lines with a link. Copy link copies the page address, which stores every input in the ?s= part of the URL, so the same calculation reopens later or can be sent to a colleague. Print / save as PDF produces a one-page record with the inputs, results, calculation steps and date.
What does a critical value mean for right-tailed, left-tailed and two-tailed tests?
A critical value is the cutoff that separates results where you reject the null hypothesis from results where you do not. The tail sets where that cutoff sits. A right-tailed critical value c satisfies P(X ≥ c) = α, and a left-tailed one satisfies P(X ≤ c) = α.
In a two-tailed test, α is split evenly, with α/2 in each tail, so you get a lower and an upper value. For z and t these two values are equal and opposite, which is why the result is written ±c. For example, α = 0.05 two-tailed gives ±1.96 for z, while α = 0.01 right-tailed gives 2.3263, meaning 1 % of the z distribution lies above that value.
Why are chi-square and F critical values not symmetric?
Chi-square and F distributions are skewed and take only values of zero or more, so a two-tailed test gives a lower and an upper value that are not mirror images. This is why the result is shown as two separate numbers for these two distributions. Their tests are normally right-tailed, because the rejection region sits in the upper tail of the statistic.
The F distribution needs two degrees of freedom. The first, df₁, is the numerator value and the second, df₂, is the denominator value, and swapping them changes the answer. With df₁ = 3 and df₂ = 10, α = 0.05 right-tailed gives 3.7083, and α = 0.01 gives 6.5523. For chi-square with df = 3 and α = 0.05 right-tailed, the value is 7.8147, and the table row for α = 0.01 gives 11.345.
Critical value vs p-value
Both lead to the same decision. The critical-value approach compares your statistic with the cutoff (reject when it falls in the rejection region); the p-value approach compares the tail area beyond your statistic with α. Use the p-value calculator when you want the exact probability as well as the verdict.
Worked examples
| Input | Result |
|---|---|
| t (df 10), α = 0.05, Two-tailed | critical value ±2.2281 |
| z, α = 0.05, Two-tailed | critical value ±1.96 |
| z, α = 0.01, Right-tailed | critical value 2.3263 |
| χ² (df 3), α = 0.05, Right-tailed | critical value 7.8147 |
| F (df 3, 10), α = 0.05, Right-tailed | critical value 3.7083 |
Calculated by the tool above with these values.
Frequently asked questions
Is the calculator free, and is anything I type uploaded?
Yes, the calculator is free, and there is no account or sign-up. Everything is calculated in your browser, so nothing you type is uploaded. Results may be used in any work, including commercial reports, theses and client projects, without attribution.
Can I print or share a calculation?
Yes. Print / save as PDF creates a one-page record with your inputs, results, calculation steps and the date. Copy link copies a page address that stores every input in the ?s= part of the URL, so the same calculation reopens later or can be sent to a colleague.
What does the warning about chi-square or F with a left or two-tailed region mean?
The calculator shows this warning because chi-square and F tests are normally right-tailed. A left-tailed or two-tailed region is unusual for these tests, so check that your method calls for it. For a two-tailed F, the warning also tells you that the α/2 tails are used.
What does the note about fewer than 3 degrees of freedom mean?
A Student t distribution with fewer than 3 degrees of freedom has very heavy tails, so its critical values are much larger than those for a normal curve. The calculator adds a note when this happens. It also adds a note when the degrees of freedom are non-integer.
What values can I enter for α?
Enter α as a decimal such as 0.05 or as a percentage such as 5 %. The value must be between 0 and 1. The table under the result lists the common levels 0.10, 0.05, 0.025, 0.01 and 0.001 for the distribution and tail you chose.
Does the result tell me whether to reject my null hypothesis?
Not on its own. The calculator gives the rejection region in words, for example “Reject H₀ when |t| > 2.2281”. You still need to compare your own test statistic with that region and confirm that your test’s assumptions fit your data.
Related tools
- T test calculator: use it to run a t test on your data, then compare the statistic with the critical value.
- Paired t test calculator: use it when the two samples are matched pairs.
- Z test calculator: use it when the z distribution is the right model for your test.
- T test vs z test: read this to decide which distribution applies to your data.
- P-value calculator: use it to find the p-value for a test statistic instead of a cutoff.
- Confidence interval calculator: use it to build an interval using the same critical values.
- Which statistical test to use: use it if you are not yet sure which test fits your question.
- Effect size calculator: use it to measure how large a result is, alongside its significance.
- Chi-square test calculator: use it to run a chi-square test on your counts.