Correlation Coefficient Calculator (Pearson r)
Paste x, y pairs to get Pearson's r, r², the p-value and a confidence interval, with the sums and a scatter plot.
Recent
Your last 10 settings, saved only in this browser. Nothing is uploaded.
This correlation coefficient calculator works out Pearson’s r, the product moment correlation coefficient, for paired data you paste in. It also reports r², a p-value and a 95 % confidence interval. It runs in your browser, is free, and needs no sign-up.
Paste one x, y pair per line, or paste two spreadsheet columns directly. The output includes a plain-words label for strength and direction, the t statistic and degrees of freedom, the sample covariance, and a scatter plot with a least-squares line.
Use it for height and weight, hours studied and score, or any two measurements. It works as a correlation test calculator, a correlation analysis tool or a Pearson coefficient solver: compute the correlation coefficient, test it and see the data in one place. Calculate the linear correlation coefficient for the data below a homework question, or use it when determining whether two measurements are related.
How to use the Correlation Coefficient Calculator
- Paste your data into the data box as one x, y pair per line. Separate the two values with a comma, space, tab or semicolon. Two spreadsheet columns can go in straight.
- Optional: put two column names on the first line, such as
Height (cm), Weight (kg). They become the axis labels. Or leave that line out and type two lists on lines startingx:andy:. - Check the number format. Use a minus sign (- or −), a decimal point, and exponents such as 3e2. Thousands separators like 1,200 work in tab-separated pastes. A decimal comma is not supported.
- Read the results as they update: r, r², the strength and direction label, n, the t statistic, degrees of freedom (n − 2), the p-value, the confidence interval for ρ and the sample covariance.
- Open More options to choose the p-value tail: two-tailed (the default), right-tailed (ρ > 0) or left-tailed (ρ < 0).
- Set the confidence level between 50 and 99.9 %. The default is 95 %.
- Look at the scatter plot under the result. Check for points that sit far from the rest.
- Open “How it was calculated” to see the formula, the values substituted and the answer.
Use the preset buttons above the form to load typical cases, including a negative correlation. Reset restores the starting example. Print / save as PDF, Copy result and Copy link are explained in the questions below.
What does the correlation coefficient measure?
Pearson’s r is a number from −1 to 1 that describes how closely paired values follow a straight line. A value near 1 means y rises in a tight straight-line pattern as x rises. A value near −1 means y falls as x rises, and a value near 0 means there is no straight-line association.
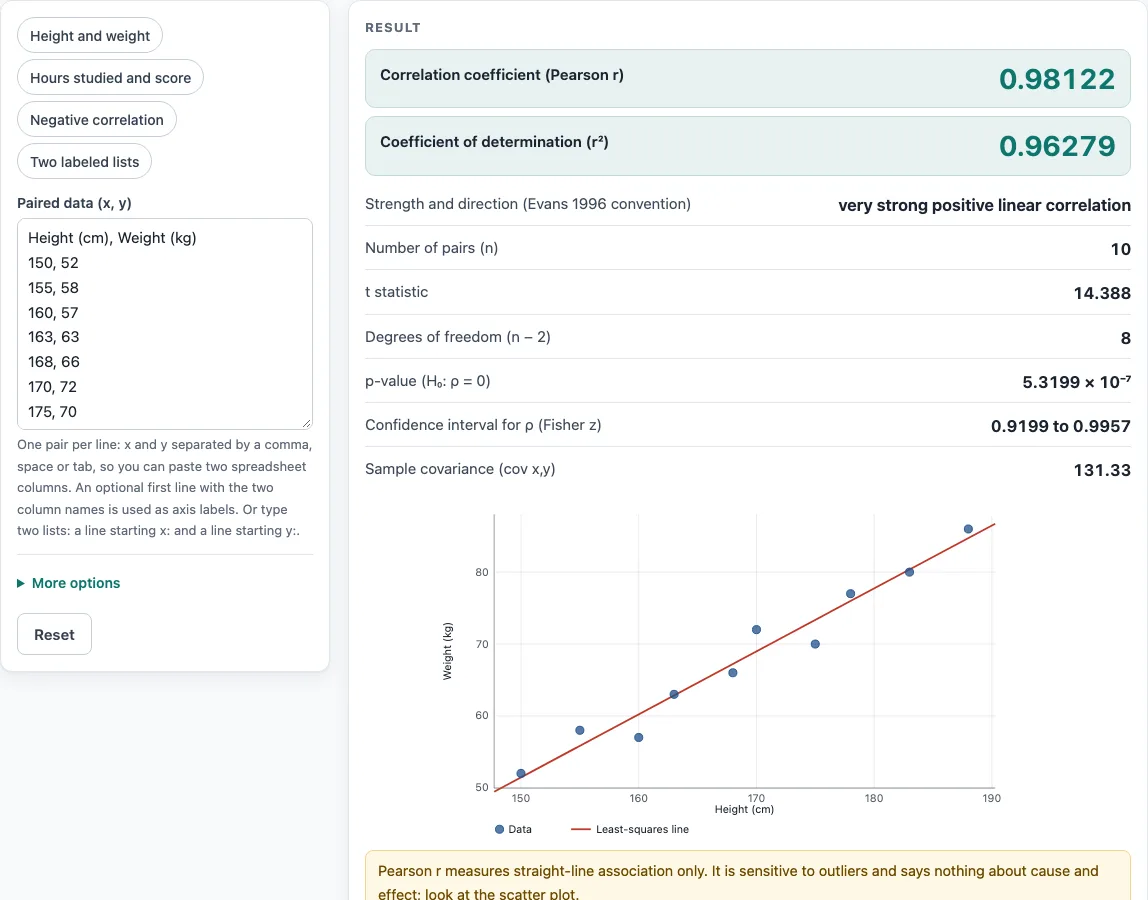
The statistic r² is the coefficient of determination. It is the share of the variation in y that the straight line accounts for. For example, r = 0.98122 gives r² = 0.96279, so about 96 % of the variation in y is explained by the line.
The calculator labels strength using wording from Evans (1996), based on |r|: 0 to 0.19 is very weak, 0.20 to 0.39 weak, 0.40 to 0.59 moderate, 0.60 to 0.79 strong, and 0.80 to 1 very strong. This is a convention. Cohen (1988) uses 0.1, 0.3 and 0.5 as small, medium and large benchmarks. Because r is sensitive to outliers, one unusual point can shift it noticeably, so check the scatter plot.
How is the correlation coefficient calculated?
The calculator works from sums over the n pairs. It computes n, Σx, Σy, Σxy, Σx² and Σy², then the means x̄ and ȳ. From these it forms the centred sums Sxx = Σ(x − x̄)², Syy = Σ(y − ȳ)² and Sxy = Σ(x − x̄)(y − ȳ).
Then r = Sxy / √(Sxx × Syy). Because the formula divides by the spread of both variables, r does not change if you rescale a variable, such as converting metres to centimetres. The sample covariance is Sxy / (n − 1).
At least 3 pairs are needed. If all x values or all y values are identical, Sxx or Syy is zero, r is undefined, and the calculator shows an error.
How does the significance test work?
The test checks H₀: ρ = 0, meaning there is no correlation in the population. The statistic is t = r√(n − 2) / √(1 − r²), with n − 2 degrees of freedom.
The p-value is the probability of seeing a correlation at least this extreme if H₀ were true. The two-tailed test asks whether ρ differs from 0 in either direction. The right-tailed test asks whether ρ > 0, and the left-tailed test asks whether ρ < 0. Choose the tail based on your question, before you look at the result. In worked example 2, the left-tailed p-value is 4.4884 × 10⁻⁷.
How is the confidence interval calculated?
The interval uses the Fisher z-transformation. The calculator computes z = atanh(r), uses a standard error of 1/√(n − 3), and then converts the interval back to the r scale with tanh. The usual normal critical value sets the width.
Because of the transformation, the interval is usually not symmetric around r. For the default example, r = 0.98122 with 10 pairs gives a 95 % interval from 0.9199 to 0.9957. The interval needs at least 4 pairs, because the standard error requires n − 3 to be greater than zero.
Worked examples
| Input | Result |
|---|---|
| 10 (x, y) pairs | r = 0.9812, r² = 0.9628, p = 5.3199 × 10⁻⁷ |
| 10 (x, y) pairs | r = 0.9844, r² = 0.969, p = 2.5548 × 10⁻⁷ |
| 7 (x, y) pairs | r = -0.9971, r² = 0.9941, p = 4.4884 × 10⁻⁷ |
| 8 (x, y) pairs | r = 0.7619, r² = 0.5805, p = 0.028005 |
Calculated by the tool above with these values.
Frequently asked questions
Is the calculator free, and is anything I type uploaded?
Yes, the calculator is free. Everything is calculated in your browser, so nothing you type is uploaded. There is no account or sign-up.
Results may be used in any work, including commercial reports, theses and client projects, without attribution. The page reminds you that the results are only as useful as the fit of the method, so check that its assumptions suit your data before you report them.
Can I print or share a calculation?
Yes. Print / save as PDF produces a one-page record that includes your inputs, results, calculation steps and the date. Copy result copies the result lines together with a link to the calculation.
Copy link copies the page address. The address stores every input in the ?s= part of the URL, so the same calculation reopens later or can be sent to a colleague.
What is the difference between r and r²?
r gives both direction and strength on a scale from −1 to 1. r² is always between 0 and 1 and shows the share of variation explained by the straight line, so it does not show direction. In worked example 2, r = −0.99706 gives r² = 0.99413.
How many pairs do I need?
At least 3 pairs are needed to compute r. With fewer than 10 pairs, r can vary a lot, and with fewer than 4 pairs no confidence interval is shown.
Does a strong correlation mean one variable causes the other?
No. r measures straight-line association only and does not show cause and effect. Both variables may be driven by a third factor, so a strong r alone cannot prove that one causes the other.
Which p-value tail should I choose?
Use the two-tailed test unless you set a direction before collecting data. Use right-tailed for ρ > 0 and left-tailed for ρ < 0.
Why does the calculator say the correlation is undefined?
This happens when all x values or all y values are identical, because there is no spread to measure. Check that each column has more than one distinct value and that the pairs line up.
Can I use decimal commas, such as 2,5?
No. Decimals must use a point, such as 2.5, because a decimal comma is not supported. In tab-separated pastes, commas are read as thousands separators, as in 1,200.
Related tools
- Spearman rank correlation calculator: use it when your data are ranked or the relationship is consistently increasing or decreasing but not straight.
- Linear regression calculator: use it to find the best-fit line and slope when you want to predict y from x.
- Multiple regression calculator: use it when you have more than one predictor variable.
- P-value calculator: use it to turn a test statistic into a p-value outside this tool.
- Which statistical test to use: use it when you are unsure which test fits your question.
- Statistics calculator: use it for other statistics not covered here.