Confidence Interval Calculator
Enter your sample numbers and a confidence level to get the confidence interval, margin of error and critical value for a mean or a proportion.
Recent
Your last 10 settings, saved only in this browser. Nothing is uploaded.
The confidence interval calculator gives a range of values that a population mean or proportion is likely to fall within, based on your sample numbers and the confidence level you choose. It covers six cases: a mean with unknown σ from summary numbers, a mean from raw data, a mean with known σ, a proportion, a margin of error from sample size, and the difference between two means. It runs in your browser, is free, and needs no sign-up.
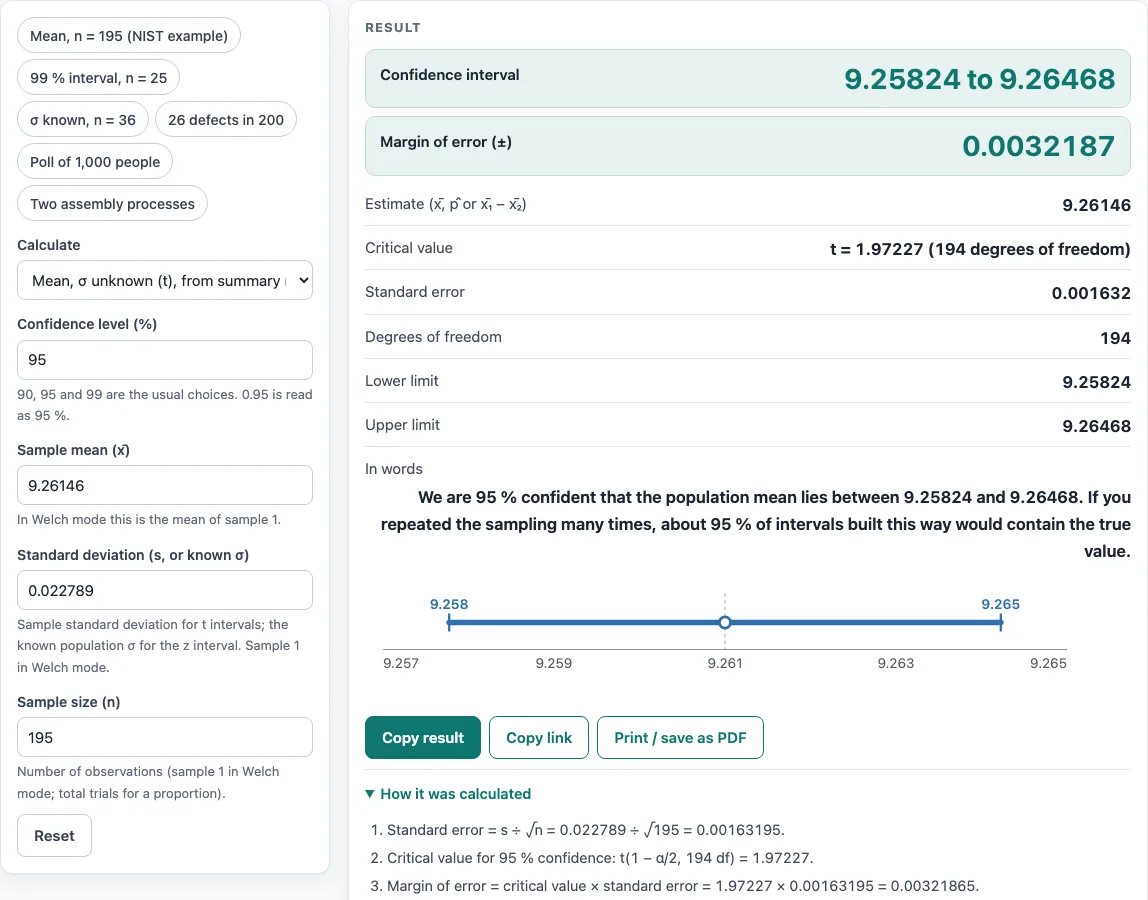
Each result shows the interval, the margin of error, the point estimate, the standard error, the critical value with its degrees of freedom, and a plain sentence explaining what the interval means. A chart and a step-by-step working section show how the answer was reached, so it doubles as a confidence interval solver for homework and a quick CI calculator for reports.
How to use the confidence interval calculator
- Under “Calculate”, choose the mode that matches your data: mean with unknown σ from summary numbers, mean from raw data, mean with known σ, proportion, margin of error from sample size, or difference of two means.
- Enter your values. For a mean, enter the mean, the standard deviation s and the sample size n. For a proportion, enter the number of successes x and the number of trials n.
- Set the confidence level. You can type any value from 1 to 99.99 percent. Values of 90, 95 and 99 percent are the usual choices, and 0.95 is read as 95 percent.
- Read the result panel: the interval, the margin of error, the standard error and the critical value.
- Open “How it was calculated” under the result to see the formula, the values substituted and the answer with units.
- Check the chart and any warnings. Warnings flag small samples, identical readings and other conditions that make the interval less reliable.
The preset buttons above the form load typical cases, and “Reset” restores the starting example. “Copy result” copies the result lines with a link. “Copy link” copies the page address, which stores every input so the same calculation can be reopened or sent to a colleague. “Print / save as PDF” produces a one-page record with the inputs, results, steps and date.
How do I calculate a 95% confidence interval for a mean?
Use x̄ ± t × s/√n, where x̄ is the sample mean, s is the sample standard deviation, n is the sample size, and t is the 1 − α/2 quantile of Student’s t distribution with n − 1 degrees of freedom. The interval is the mean plus and minus the margin, which is t × s/√n.
For a 95% interval, α is 0.05, so you look up the t value at the 97.5th percentile. The NIST example with n = 195, mean 9.26146 and s = 0.022789 gives t = 1.97227, a standard error of 0.022789/√195 = 0.00163195, and a margin of 0.00321865. The interval runs from 9.25824 to 9.26468. Read it as: if you repeated the sampling many times, about 95 % of intervals built this way would contain the true mean.
What is the confidence interval for a proportion and which formula should I use (Wald or Wilson)?
Use the Wilson score interval. The Wald interval is p̂ ± z√(p̂(1 − p̂)/n), and it is the simpler formula, but it can give limits below 0 or above 100 percent. Wilson keeps its limits between 0 and 100 percent and works for small samples and for proportions close to 0 or 1, so it is the recommended choice (NIST e-Handbook 7.2.4.1; Brown, Cai and DasGupta 2001).
The calculator shows both. For 26 defects in 200 parts at 95 percent, p̂ is 13 percent, the Wilson interval is 9.028 to 18.37 percent, and the Wald interval is 8.339 to 17.66 percent. When the expected successes or failures are below 10, a warning appears next to the Wald interval, so read it before relying on that interval.
Sources
- NIST/SEMATECH e-Handbook: confidence limits for the mean (the n = 195 example), t distribution critical values, confidence intervals for proportions (Wilson), comparing two means (Welch)
- Brown, Cai and DasGupta (2001), Interval estimation for a binomial proportion, Statistical Science 16(2)
Worked examples
| Input | Result |
|---|---|
| mean 9.26146, s 0.022789, n 195, 95 % | 9.2582 to 9.2647 |
| mean 72.4, s 8.1, n 25, 99 % | 67.869 to 76.931 |
| mean 100, σ 15, n 36, 95 % | 95.1 to 104.9 |
| 26 of 200, 95 % | 9.028 % to 18.37 % |
| n 1000, proportion 50 %, 95 % | 46.9 % to 53.1 % |
| x̄₁ 36.0909 (n 11), x̄₂ 32.2222 (n 9), 95 % | 0.24598 to 7.4914 |
Calculated by the tool above with these values.
Frequently asked questions
What critical value do I use for 90, 95 and 99 percent confidence?
For a z interval, the two-sided critical values are 1.645 for 90 percent, 1.960 for 95 percent and 2.576 for 99 percent. This calculator shows the exact critical value in every result, so it works as a critical value calculator for these cases. For a t interval, the value also depends on the degrees of freedom and is larger for small samples.
Do I use z or t for a confidence interval?
Use t when the population standard deviation σ is unknown and you estimate it with s, which is the usual case. Use z only when σ is known. The calculator warns you when n is below 15 for the t interval or below 30 for the z interval; these are common textbook guidelines, not fixed rules.
How do I calculate the margin of error for a survey?
Use z × √(p(1 − p)/n), where n is the sample size and p is the assumed proportion. When you do not know p, use 50 percent, which gives the widest margin. A poll of 1,000 people at 50 percent and 95 percent confidence has a margin of error of ±3.099 percent.
How do I find a confidence interval for the difference of two means?
The calculator uses Welch’s method, which does not assume the two groups have equal variances. For sample means 36.0909 (s 4.9082, n 11) and 32.2222 (s 2.5386, n 9), the 95 percent interval for the difference is 0.246 to 7.491 with 15.53 degrees of freedom. The result also states whether the interval contains 0.
Can I use the results in commercial projects or client reports?
Yes. Results may be used in any work, including commercial reports, theses and client projects, without attribution. Check that the method’s assumptions fit your data before you report the results.
Is the calculator free, and is anything I type uploaded?
The calculator is free and has no account or sign-up. Everything is calculated in your browser, and nothing you type is uploaded.
Related tools
- Statistics calculator — every summary statistic for one data set
- Standard deviation calculator — sample and population SD with every step
- Mean, median and mode calculator — the centre of a data set and its range
- Box and whisker plot calculator — quartiles, IQR, fences and outliers
- Percentile calculator — any percentile or the rank of a value
- Relative standard deviation calculator — the SD as a percentage of the mean
- T test calculator — compare a mean with a value or two means
- Paired t test calculator — before/after and matched-pair data
- Z test calculator — means with known σ and proportions