Chi-Square Goodness of Fit Calculator
Enter observed counts and the expected counts or ratio to test whether the data follow that distribution.
Recent
Your last 10 settings, saved only in this browser. Nothing is uploaded.
The chi-square goodness-of-fit calculator tests whether observed counts in k categories match an expected distribution. You enter the counts you collected, choose how the expected values are set, and the page returns the chi-square statistic, degrees of freedom, p-value and a decision at your chosen significance level. It works for anything that sorts results into categories, such as die rolls, genetic ratios or survey answers.
The calculator runs entirely in your browser, so the numbers you type are calculated on your own device. It is free and needs no account or sign-up. Results update as you type, and a table shows the working for each category.
How to use the Chi-square goodness-of-fit calculator
- Type the observed counts into the observed box, one per category. Separate them with spaces, commas or new lines. You need between 2 and 200 categories. You can paste a column straight from a spreadsheet.
- Choose how the expected values are given:
- Equal: every category is expected to get N / k observations.
- Expected counts: type one expected count per category. They must add up to the observed total.
- Proportions, percentages or ratios: type shares such as
0.5 0.5,50 50or9 3 3 1. The calculator scales them to the observed total.
- If you estimated parameters from the data, enter the number in the advanced box, “Parameters estimated from the data”. It defaults to 0.
- Set alpha if you need a value other than 0.05.
- Read the main result, then check the decision and the table. Open “How it was calculated” to see the formula with your numbers.
Use a preset button above the form to load a typical case, or press Reset to return to the starting example. Some less common inputs sit under “More options”. “Copy link” saves every input in the page address, so the same calculation reopens later or can be sent to a colleague. “Print / save as PDF” produces a one-page record of the inputs, results, steps and date.
What is goodness of fit?
Goodness of fit is a check on how well a set of observed counts agrees with an expected pattern. The chi-square goodness-of-fit test compares each observed count (O) with its expected count (E) and adds up the squared differences, scaled by E. A small statistic means the data sit close to what you expected; a large one means they do not.
How is the chi-square statistic calculated?
The statistic is χ² = Σ (O − E)² / E, summed over all k categories. Each category contributes (O − E)² / E, and the calculator shows these contributions in its table. The degrees of freedom are k − 1 − m, where m is the number of parameters estimated from the data.
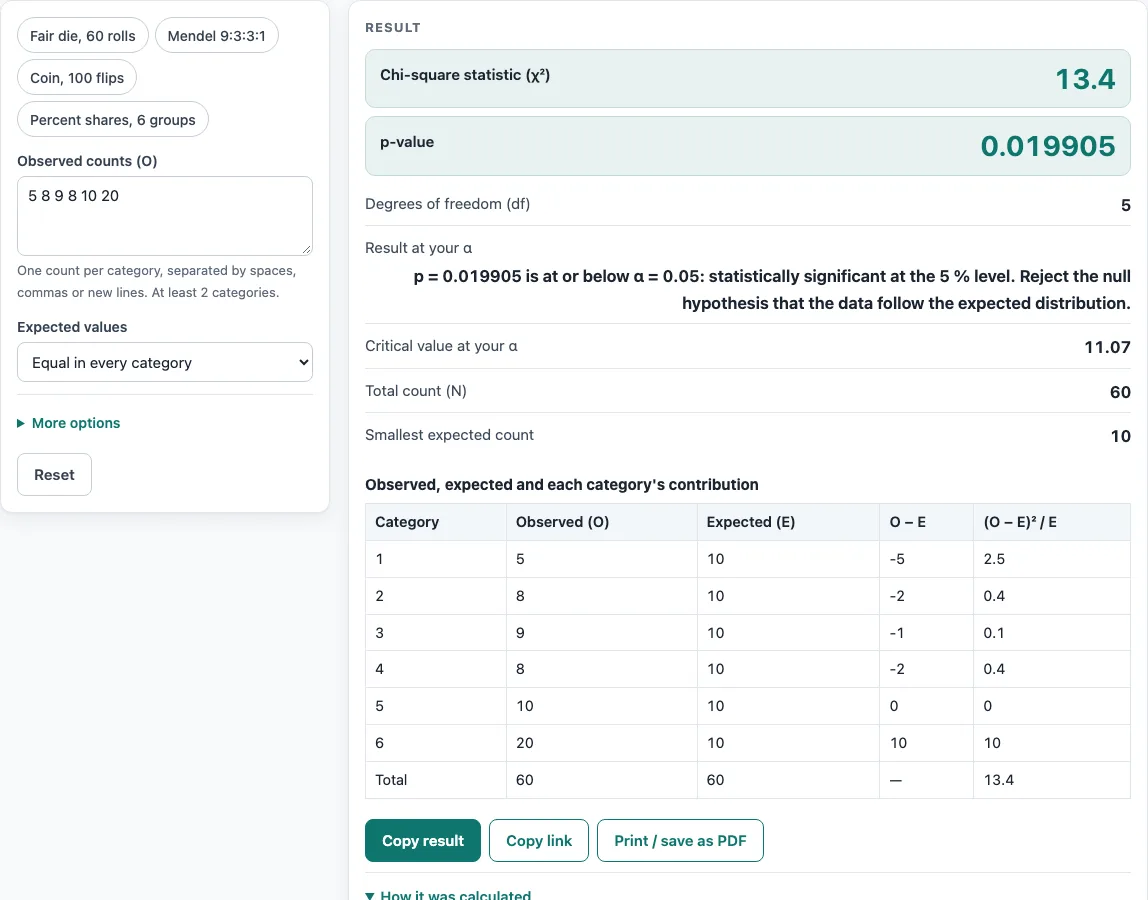
For the default example, a die rolled 60 times gave counts 5, 8, 9, 8, 10 and 20 against 10 expected in each face. The contributions are 2.5, 0.4, 0.1, 0.4, 0, and 10, which sum to χ² = 13.4 with df = 5.
How do you choose the expected values?
Use equal expected counts when every category should be equally likely, such as a fair die or an even spread. Use expected counts when you already know the number expected in each category. Use proportions when you know the shares, such as a 9:3:3:1 genetic ratio. The calculator divides the shares by their sum and multiplies by the observed total, so the totals always match.
When can you trust the chi-square goodness-of-fit result?
The p-value from this test is approximate, and it works best when the expected counts are large enough. The calculator warns you when any expected count is below 5, and it reports how many categories are affected. The usual remedy is to merge small categories until the warning clears, following the rule of thumb in NIST/SEMATECH 1.3.5.15 and the minimum-count guidance from Cochran (1954). Observed values should also be whole counts. Percentages or rates give wrong p-values.
How do you read the p-value and the decision?
Compare the p-value with alpha. If p is at or below alpha, reject the null hypothesis that the data follow the expected distribution. If p is above alpha, the data do not give enough evidence against that distribution. The calculator also shows the critical value at alpha, and it flags any p-value within 2% of alpha as a borderline case.
For Mendel’s pea counts 315, 108, 101 and 32 against a 9:3:3:1 ratio (N = 556), χ² = 0.47002 with df = 3 and p = 0.92543. That is well above 0.05, so the counts are consistent with the 9:3:3:1 ratio (the test cannot prove the ratio is exact).
Worked examples
| Input | Result |
|---|---|
| 6 categories, N = 60, equal expected counts | χ² = 13.4, df = 5, p = 0.019905, significant at α = 0.05 |
| 4 categories, N = 556, expected proportions | χ² = 0.47, df = 3, p = 0.92543, not significant at α = 0.05 |
| 2 categories, N = 100, given expected counts | χ² = 1.44, df = 1, p = 0.23014, not significant at α = 0.05 |
| 6 categories, N = 88, expected proportions | χ² = 3.364, df = 5, p = 0.64411, not significant at α = 0.05 |
| 4 categories, N = 100, equal expected counts | χ² = 20, df = 2, p = 4.54 × 10⁻⁵, significant at α = 0.05 |
Calculated by the tool above with these values.
Frequently asked questions
Is the calculator free, and is anything I type uploaded?
Yes, the calculator is free and needs no account or sign-up. All calculations run in your browser, and nothing you type is uploaded.
Can I print or share a calculation?
Yes. “Print / save as PDF” creates a one-page record with the inputs, results, calculation steps and the date. “Copy link” copies a page address that stores your inputs, so anyone who opens it sees the same calculation.
Can I use the results in a report or thesis?
Yes. You may use the results in any work, including commercial reports, theses and client projects, without attribution. Check that the method’s assumptions fit your data before you report them.
Why does the calculator say my expected counts are too small?
When any expected count is below 5, the chi-square approximation can be unreliable. The page lists how many categories are affected and suggests merging categories to remove the warning.
Do the observed counts have to be whole numbers?
Yes. Counts of individual outcomes must be whole numbers. If you enter percentages or rates, the p-value will be wrong, so convert them back to counts first.
Can I enter percentages as the expected distribution?
Yes. Choose proportions or percentages for the expected values; the calculator rescales them to the observed total, so 25, 25, 50 or 1:1:2 both work.
Related tools
- Chi-square test calculator: use it for a chi-square test on a contingency table rather than a single set of categories.
- One-way ANOVA calculator: use it to compare the means of three or more independent groups.
- Two-way ANOVA calculator: use it when you have two factors and want to test their effects and interaction.
- Odds ratio calculator: use it to measure how strongly an exposure is linked to an outcome in a 2×2 table.
- P-value calculator: use it to convert a test statistic into a p-value.
- Critical value calculator: use it to find the cutoff value for a given significance level.
- Which statistical test to use: use it when you are not sure which test fits your question and data.