Chi-Square Test Calculator
Paste a table of counts to test whether two categorical variables are independent: χ², p-value, expected counts and Cramér's V.
Recent
Your last 10 settings, saved only in this browser. Nothing is uploaded.
How to use the Chi-square calculator
- Enter your table. Type or paste one row per line, with cells separated by tabs, commas or spaces. A spreadsheet paste works. A header row of column names and a first column of row labels are optional and detected automatically.
- Check that the table holds counts only. Do not include row or column totals, and keep every row the same length.
- Set the significance level (alpha). The default is 0.05, and 0.05, 5 or 5 % are all accepted.
- For a 2 x 2 table, decide whether to tick the Yates continuity correction. It is off by default.
- Read the main result, the chi-square statistic, then the degrees of freedom, p-value, decision, critical value and Cramer’s V.
- Look at the observed, expected and contribution tables to see which cells drive the result.
- Read any warnings above the result, and open “How it was calculated” to see the formula and the numbers used.
The presets above the form load three typical cases: a 2 x 3 drink-by-sex table, a 2 x 2 treatment table with and without Yates, and a 3 x 4 results-by-region table. Reset restores the starting example at any time.
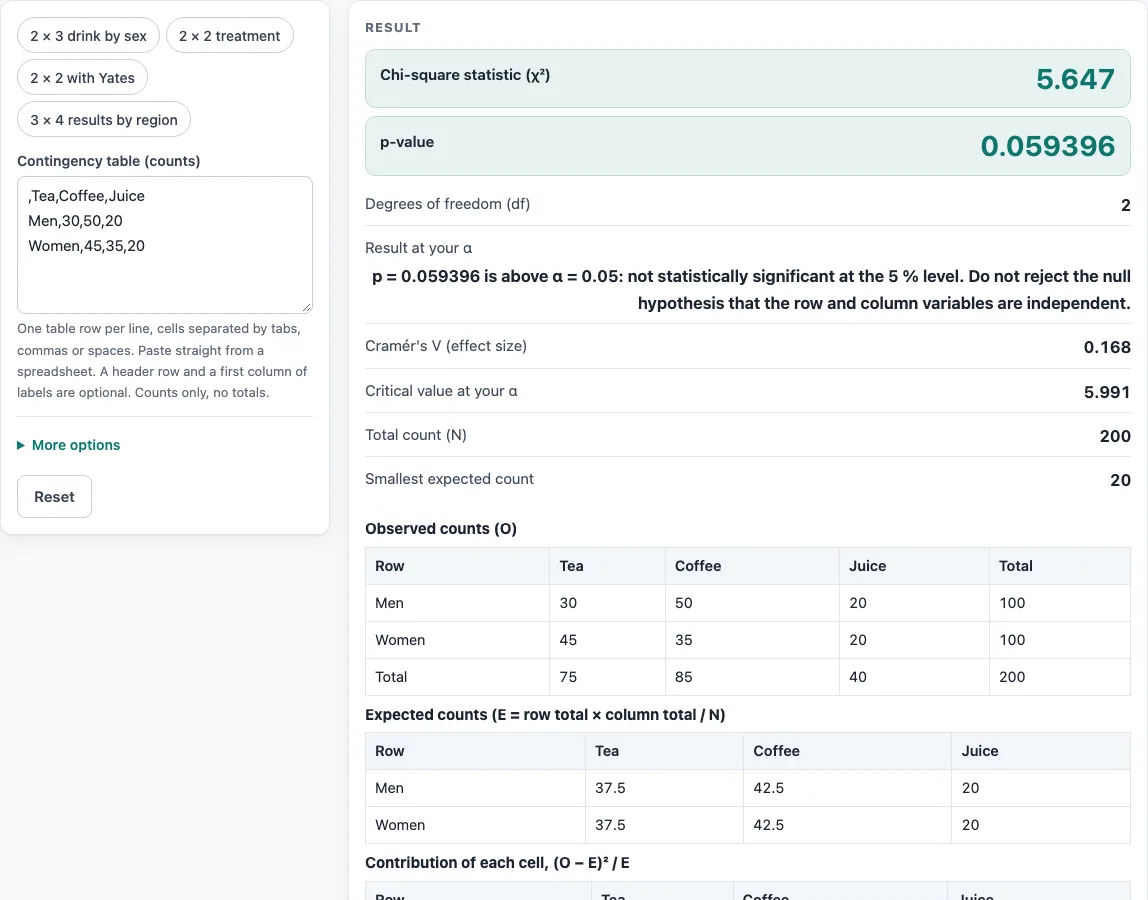
Example: the default table (men and women choosing tea, coffee or juice, N = 200) gives χ² = 5.647 with 2 degrees of freedom and p = 0.059396, so independence is not rejected at α = 0.05.
What is chi square?
Chi-square (χ²) is a statistic that measures how far observed counts in a table differ from the counts you would expect if two categorical variables had no relationship. For each cell, the expected count is the row total times the column total, divided by the grand total N. The statistic adds up (O − E)² / E over all cells, so a larger value means a bigger gap between what was observed and what was expected.
The default example is a 2 x 3 table of drink choice by sex with N = 200. It gives χ² = 5.647 with 2 degrees of freedom. Degrees of freedom are (rows − 1) × (columns − 1), which here is 1 × 2 = 2. The p-value is 0.059396, which is above 0.05, so the result is not significant at that level.
What is a chi square test used for?
A chi-square test of independence asks whether two categorical variables seem related or whether they appear independent. The null hypothesis is that they are independent. The test rejects that hypothesis when the p-value is at or below alpha. Cramer’s V is reported alongside as a rough guide to the strength of the association, and for 2 x 2 tables it equals the phi coefficient.
A significant result means the data are unlikely under independence. It does not show that one variable causes the other.
How are the expected counts found?
Each expected count is (row total × column total) ÷ grand total. In the default table 75 of 200 people chose tea and 100 were men, so the expected number of men choosing tea is 100 × 75 ÷ 200 = 37.5, against 30 observed. The contribution table shows which cells add most to χ², which tells you where the association comes from.
Worked examples
| Input | Result |
|---|---|
| 2 × 3 table, N = 200 | χ² = 5.647, df = 2, p = 0.059396, not significant at α = 0.05 |
| 2 × 2 table, N = 40 | χ² = 6.32, df = 1, p = 0.011939, significant at α = 0.05 |
| 2 × 2 table, N = 40, Yates correction | χ² = 4.812, df = 1, p = 0.028258, significant at α = 0.05 |
| 3 × 4 table, N = 650 | χ² = 24.57, df = 6, p = 4.0984 × 10⁻⁴, significant at α = 0.05 |
Calculated by the tool above with these values.
Frequently asked questions
Is the calculator free, and is anything I type uploaded?
Yes, the calculator is free to use. Everything is calculated in your browser, and nothing you type is uploaded. There is no account or sign-up.
Can I print or share a calculation?
Yes. “Copy link” copies the page address, which stores every input in the ?s= part of the URL, so the same calculation reopens later or can be sent to a colleague. “Copy result” copies the result lines with a link. “Print / save as PDF” produces a one-page record with the inputs, results, calculation steps and date.
What does the Yates correction do, and should I use it?
The Yates continuity correction applies to 2 x 2 tables only. It reduces each |O − E| by 0.5, never below zero, and is off by default. For the table 12, 5 / 7, 16 (N = 40), the p-value is 0.011939 without the correction and 0.028258 with it. Some statistics software applies the correction by default and some textbooks do not, so check which version your course or journal expects. If you tick the box for a larger table, the page warns you that it is ignored.
Why does the calculator warn about expected counts below 5?
The chi-square approximation is least reliable when expected counts are small. If any expected count is below 5, the page tells you how many cells are affected and the smallest expected count. For a 2 x 2 table, it names Fisher’s exact test as the usual alternative and points to the odds ratio calculator on this site, which reports the Fisher exact p-value. For larger tables, it cites Cochran’s rule of thumb and suggests combining categories that make sense together.
Can I use the results in a report or thesis?
Yes. The results may be used in any work, including commercial reports, theses and client projects, without attribution. Under the result, the page reminds you to check that the method’s assumptions fit your data before you report them.
What is the p-value telling me?
The p-value is the probability of seeing a chi-square statistic at least this large if the two variables were truly independent. The calculator compares it with alpha. If p is at or below alpha, the result is significant at that level.
Related tools
- Sample size calculator: use it before data collection to estimate how many participants you need.
- Power analysis calculator: use it to check the chance of detecting an effect of a given size.
- Effect size calculator: use it to measure how large a difference or association is, not just whether it is significant.
- Confidence interval calculator: use it to show a plausible range for an estimate.
- T test calculator: use it to compare means between two groups rather than counts in categories.
- Odds ratio calculator: use it for 2 x 2 tables when you need the odds ratio and Fisher exact p-value.
- Chi-square goodness of fit calculator: use it to test whether one categorical variable matches an expected distribution.
- One-way ANOVA calculator: use it to compare means across three or more groups.
- Two-way ANOVA calculator: use it to compare means across two factors and their interaction.