Box and Whisker Plot Calculator
Paste one or more data sets to get the five-number summary, IQR, outlier fences and a box and whisker plot for each.
Recent
Your last 10 settings, saved only in this browser. Nothing is uploaded.
How to use the Box and whisker plot calculator
- Type or paste your numbers into the input area. Separate them with commas, spaces or new lines.
- To compare up to four data sets, put a blank line between them, or start each one with a name and a colon, for example
Class A: 62 70 71. - Read the five-number summary for each set: minimum, Q1, median, Q3 and maximum. The IQR (Q3 − Q1) appears with it.
- Check the fences and the outlier list. Values beyond the fences are outliers, and far-out outliers are marked separately.
- Look at the box plot. Each set has a box from Q1 to Q3, a thick line at the median, whiskers, and markers for outliers.
- Open “How it was calculated” under the result to see the formula, the values substituted and the answer with units.
- Choose a quartile method under “Quartile method” if your course or software uses a different one, and open More options to change the fence multiplier (default 1.5). Use the preset buttons above the form to load typical cases, or press Reset to return to the starting example.
Copy result copies the result lines with a link. Copy link copies the page address, and Print / save as PDF produces a one-page record of the inputs, results and steps.
How do I make a box and whisker plot and find the five-number summary?
A box and whisker plot is built from five numbers: the minimum, the first quartile (Q1), the median, the third quartile (Q3) and the maximum. You find them by sorting the data from smallest to largest and splitting it at the median. The box runs from Q1 to Q3, the line inside it marks the median, and the whiskers reach toward the minimum and maximum.
The default method, median of halves, works in four steps. Sort the values. Find the median of the whole set. Take the values below the median as the lower half, and the values above it as the upper half, leaving out the middle value when the count is odd. The median of each half is Q1 and Q3. The IQR is Q3 − Q1, the width of the box and the spread of the middle half of the data.
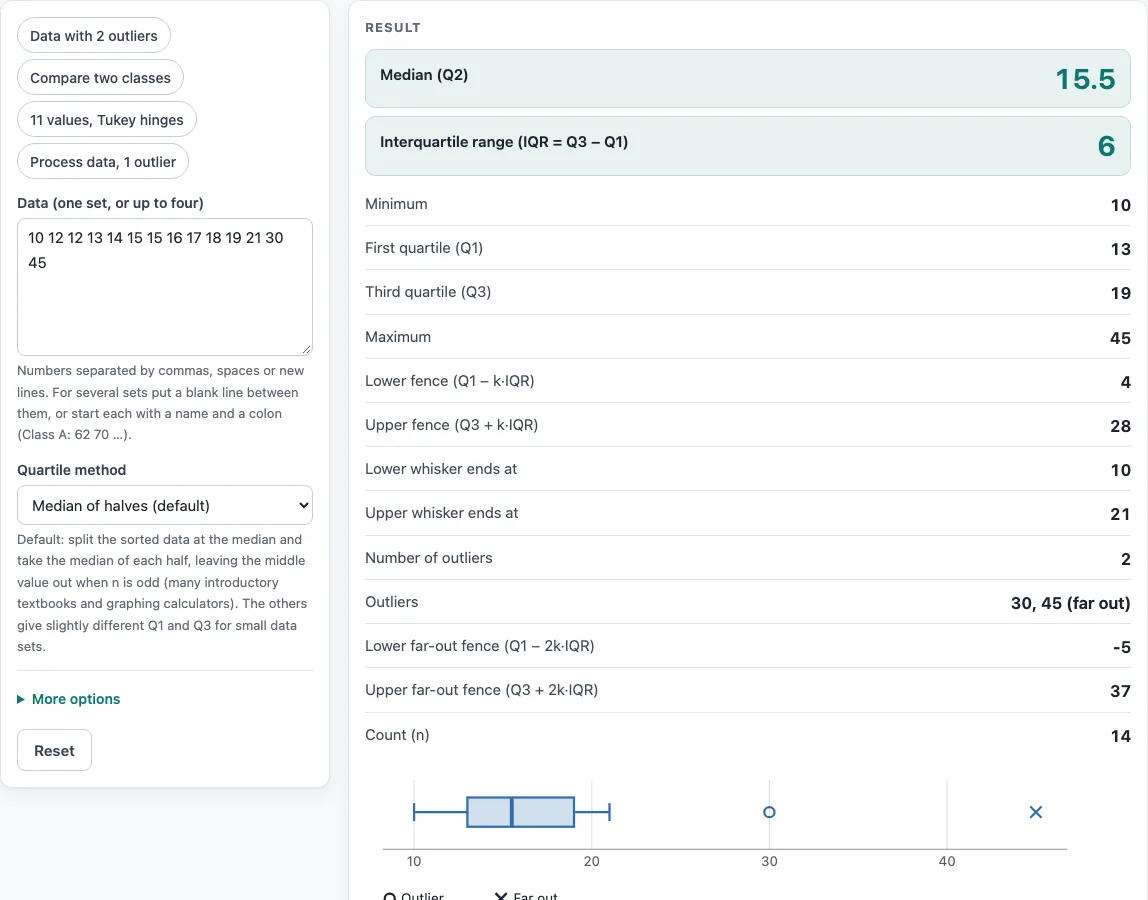
Take the example 10 12 12 13 14 15 15 16 17 18 19 21 30 45. It has 14 values, so the median is the average of the 7th and 8th values: (15 + 16) / 2 = 15.5. The lower half, 10 12 12 13 14 15 15, has median 13, so Q1 = 13. The upper half, 16 17 18 19 21 30 45, has median 19, so Q3 = 19. The IQR is 19 − 13 = 6. The minimum is 10 and the maximum is 45.
How do I find outliers with the upper and lower fence?
Fences mark the range where ordinary values lie, using Tukey’s rule. The lower fence is Q1 − 1.5 × IQR and the upper fence is Q3 + 1.5 × IQR. Values outside these fences are outliers. Far-out outliers lie beyond Q1 − 3 × IQR or Q3 + 3 × IQR.
For the example, the IQR is 6, so the lower fence is 13 − 9 = 4 and the upper fence is 19 + 9 = 28. The value 30 lies above 28 but below the far-out fence of 37, so it is an outlier. The value 45 is above 37, so it is a far-out outlier. The whiskers stop at the most extreme values still inside the fences, which are 10 and 21, not at the fences themselves. The multiplier 1.5 can be changed under More options, and the far-out fences then use twice that value.
Sources
- Box plot, fences at 1.5 × IQR and far-out values at 3 × IQR (Tukey): NIST/SEMATECH e-Handbook, box plot
- Quartile methods: NIST e-Handbook, percentiles; Wikipedia, Quartile (median of halves, Tukey hinges, linear interpolation)
Worked examples
| Input | Result |
|---|---|
| 1 data set(s), 14 values | Q1 13, median 15.5, Q3 19, 2 outlier(s) |
| 1 data set(s), 11 values | Q1 25.5, median 40, Q3 42.5, 0 outlier(s) |
| 2 data set(s), 19 values | Q1 71, median 79, Q3 85, 0 outlier(s) |
| 1 data set(s), 11 values | Q1 2.2, median 2.3, Q3 2.45, 1 outlier(s) |
| 1 data set(s), 6 values | Q1 13, median 37.5, Q3 40.25, 0 outlier(s) |
Calculated by the tool above with these values.
Frequently asked questions
Why do different calculators give different quartiles?
There is no single standard method for finding quartiles, so tools split the data by different rules. This calculator offers four: median of halves (the default), Tukey hinges, the NIST rule at position p(n + 1), and linear interpolation at position 1 + p(n − 1). For small sets the difference can be large. For 6 7 15 36 39 40 41 42 43 47 49, the default and the NIST rule give Q1 = 15 and Q3 = 43, while Tukey hinges give 25.5 and 42.5.
What do the whiskers of a box plot show?
The whiskers run from the box to the most extreme data values that still lie inside the fences. They do not end at the fences themselves. Values beyond the whiskers are shown as outliers.
How do I compare two data sets with box plots?
Separate the sets with a blank line, or start each with a name and a colon, such as Class A: 62 70 71. The plots share one axis, so the boxes line up for direct comparison, and a comparison table puts the statistics side by side.
Can I use the results in commercial projects or client reports?
Yes. Results may be used in any work, including commercial reports, theses and client projects, without attribution. Check that the method’s assumptions fit your data before you report the results.
Is the calculator free, and is anything I type uploaded?
The calculator is free and needs no account or sign-up. Everything is calculated in your browser, and nothing you type is uploaded.
Can I print or share a calculation?
Yes. The printed one-page record includes the inputs, results, calculation steps and date. Copy link stores your inputs in the ?s= part of the page address, so the same calculation reopens later or can be sent to a colleague.
Related tools
- Statistics calculator — every summary statistic for one data set
- Standard deviation calculator — sample and population SD with every step
- Mean, median and mode calculator — the centre of a data set and its range
- Percentile calculator — any percentile or the rank of a value
- Relative standard deviation calculator — the SD as a percentage of the mean
- Confidence interval calculator — a range for a mean, a proportion or a difference