Binomial Distribution Calculator
Enter n, p and x to get any binomial probability — exactly, at most, at least or between — with the table and chart.
Recent
Your last 10 settings, saved only in this browser. Nothing is uploaded.
The binomial distribution calculator gives the probability of a set number of successes in a fixed number of independent trials, when every trial has the same chance of success. Enter the number of trials n, the success probability p and the number of successes x, then choose one of six probability options, such as P(X ≤ x) or P(X = x).
The result updates as you type. The calculator runs in your browser, it is free, and there is no sign-up. It works as a binomial probability calculator for coin flips, pass or fail checks and similar cases where each trial has two outcomes: a binomial pdf calculator for P(X = x), a cdf calculator for P(X ≤ x), and a solver that can compute any binomial probability for the random variable X in a binomial experiment.
How to use the Binomial distribution calculator
- Enter the number of trials n. It must be a whole number from 1 to 1,000,000.
- Enter the success probability p, a value from 0 to 1.
- Enter the number of successes x as a whole number from 0 to n.
- Choose a probability option: P(X = x) exactly, P(X ≤ x) at most, P(X < x) fewer than, P(X ≥ x) at least, P(X > x) more than, or P(x₁ ≤ X ≤ x₂) between two values.
- If you choose the between option, enter the upper value x₂ in the field that appears. It must not be smaller than x₁.
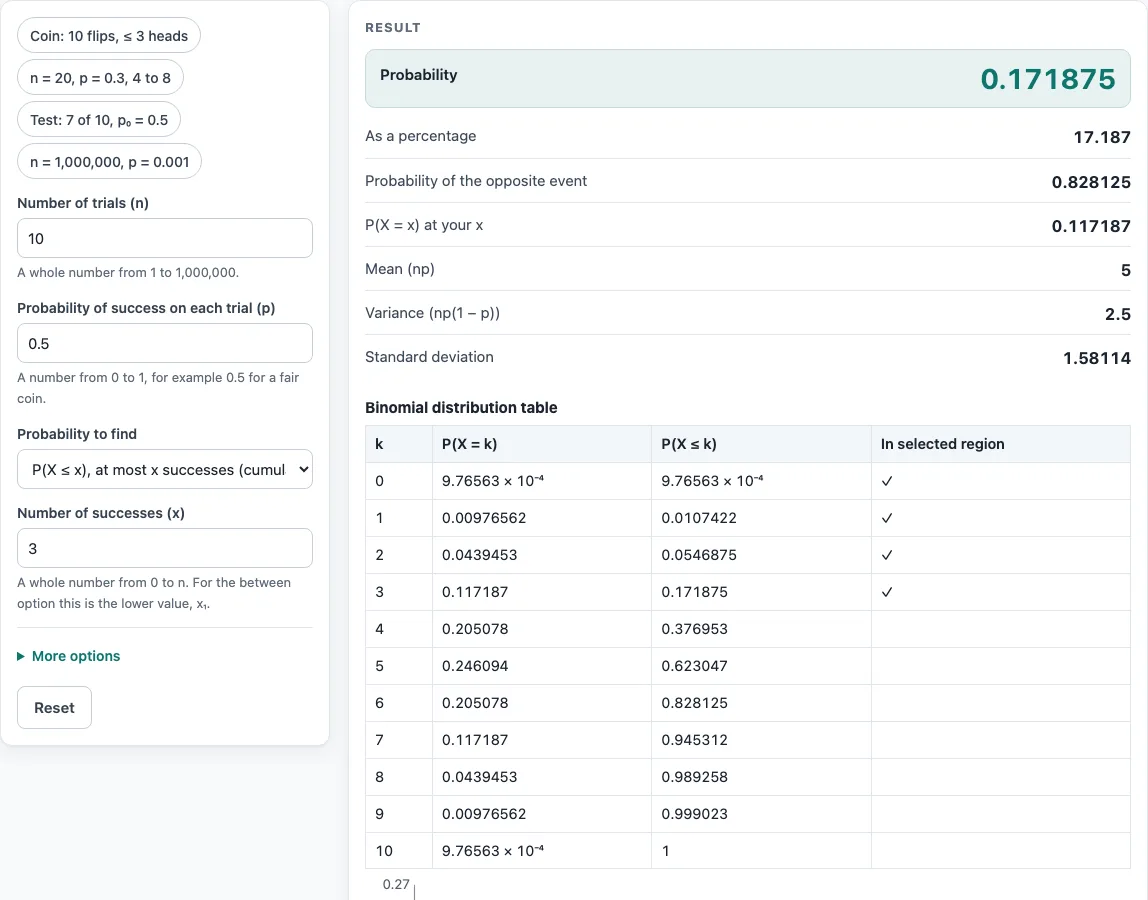
- Read the result. The probability is shown to 6 significant figures, with a percentage, the probability of the opposite event and P(X = x). Open “How it was calculated” under the result to see the formula, the values substituted and the answer.
- Scroll to the table and bar chart to see each P(X = k) and the cumulative values, with your selected region marked.
- Optional: open “Also run the exact binomial test” to test H₀: p equals the value you entered.
Preset buttons above the form load typical cases, and Reset restores the starting example (n = 10, p = 0.5, x = 3). Copy result copies the result lines with a link. Copy link copies a page address that stores your inputs, and Print / save as PDF creates a one-page record with the inputs, results, steps and date.
How is a binomial probability calculated?
A binomial experiment has a fixed number n of trials. Each trial has two outcomes, success or failure. The trials are independent, and the chance of success p is the same for every trial. The random variable X counts the successes. The probability of exactly x successes is C(n, x) × pˣ × (1 − p)ⁿ⁻ˣ, where C(n, x) is the number of ways to choose which x trials succeed.
Binomial pdf vs cdf: exact or cumulative probability
The probability mass function (often called the binomial pdf) gives P(X = x) for one value. The cumulative distribution function (cdf) gives P(X ≤ x). Cumulative options add the point probabilities. P(X ≤ x) sums from 0 to x, and P(x₁ ≤ X ≤ x₂) sums from x₁ to x₂. The mean is np and the variance is np(1 − p). For n = 20 and p = 0.3, the mean is 6 and the variance is 4.2. When the variance is at least 10, the calculator also shows a normal approximation with continuity correction for comparison, but the exact value is always the answer shown. Example: with 10 fair coin flips (n = 10, p = 0.5), P(X ≤ 3) = 0.171875, so three heads or fewer happen about 17 % of the time.
When is a situation binomial?
Check four conditions: a fixed number of trials n decided in advance, two outcomes per trial, the same success probability p every time, and independent trials. Drawing cards without replacement breaks independence (use the hypergeometric distribution instead), and counting events in a time span with no fixed n is a Poisson situation. Example: if 20 % of parts from a supplier fail inspection and you check 15, the number of failures follows a binomial distribution with n = 15 and p = 0.2.
Worked examples
| Input | Result |
|---|---|
| n = 10, p = 0.5, P(X ≤ 3) | 0.171875 |
| n = 20, p = 0.3, P(4 ≤ X ≤ 8) | 0.779582 |
| n = 10, p = 0.5, P(X = 7) | 0.117187; exact test p = 0.34375 |
| n = 100, p = 0.5, P(X ≥ 60) | 0.028444; exact test p = 0.0568879 |
| n = 1000000, p = 0.001, P(X > 1099) | 9.57467 × 10⁻⁴ |
Calculated by the tool above with these values.
Frequently asked questions
Is the calculator free, and is anything I type uploaded?
Yes, the calculator is free, and nothing you type is uploaded. Every calculation runs in your browser, and there is no account or sign-up. Results may be used in any work, including commercial reports, theses and client projects, without attribution.
The page reminds you that results are calculated from the data you enter. Check that the method’s assumptions fit your data before you report them.
Can I print or share a calculation?
Yes. Print / save as PDF produces a one-page record with the inputs, the results, the calculation steps and the date. Copy link copies the page address, which stores every input in the ?s= part of the URL, so the same calculation reopens later or can be sent to a colleague.
Copy result copies the result lines with a link, which suits notes or a report draft.
What does the exact binomial test show?
The optional test treats x as the observed number of successes and tests H₀: p equals the p you entered. The two-sided p-value adds up P(X = k) for every k whose probability is no greater than P(X = x). With 7 successes in 10 trials and p = 0.5, the p-value is 0.34375.
What happens when n is 200 or more?
The table then shows 200 values centred on the mean, and a note says so. The bar chart shows about the mean ± 4.5 standard deviations, so the region you selected stays visible.
Can I use very large values of n?
Yes. Probabilities are computed with Loader’s saddle-point algorithm in a log-safe form, so n up to 1,000,000 works. For example, with n = 1,000,000 and p = 0.001, P(X > 1099) = 0.000957467.
Why are very small tail probabilities still accurate?
Range probabilities are sums of point probabilities, so tiny tails keep their relative accuracy. For example, P(X ≤ 5) with n = 100 and p = 0.5 is 6.26162 × 10⁻²³.
Why does the calculator show a warning or an error?
A warning appears when p is 0 or 1, because the outcome is certain. A warning also appears when no whole number of successes meets the condition, such as P(X < 0), which has probability 0. An error appears if x is not a whole number from 0 to n, or if x₂ is smaller than x₁.
What do the preset buttons load?
They load four typical cases: 10 coin flips with at most 3 heads, n = 20 and p = 0.3 between 4 and 8, the exact test with 7 successes in 10 trials and p₀ = 0.5, and n = 1,000,000 with p = 0.001 for more than 1,099 successes.
Related tools
- Poisson distribution calculator: use it for counts of events in a fixed interval when the number of trials is not fixed.
- P-value calculator: use it to convert a test statistic into a p-value for other test types.
- Critical value calculator: use it to find the cut-off values for a chosen significance level.
- Which statistical test to use: use it to choose a test when you are unsure which one fits your data.
- Odds ratio calculator: use it to compare the odds of an outcome between two groups.
- Statistics calculator: use it to find other statistical tools in one place.