One-Way ANOVA Calculator
Paste one column per group to get the ANOVA table, F and p-value, effect sizes and Tukey HSD comparisons of every pair.
Recent
Your last 10 settings, saved only in this browser. Nothing is uploaded.
How to use the ANOVA calculator
- Choose a layout. “One column per group” is the default and takes a spreadsheet paste. “One group per line” takes lines such as
Ward A: 4 5 6 7 5or just4 5 6. - Paste or type your values into the text box. In column layout, you can add an optional first row of group names. Leave cells empty if your columns have different lengths. Values can be separated by tabs, commas, spaces or new lines. In line layout, a group name with spaces needs a colon.
- Check that you have 2 to 30 groups, that every group has at least one value, and that at least one group has two or more values.
- Set alpha if you need a value other than 0.05.
- Leave the Tukey HSD box ticked to compare every pair of groups, or untick it to skip those comparisons.
- Read the result: the F statistic, p-value, decision, degrees of freedom, eta squared, omega squared, critical F, grand mean, N and the Levene test. Read any warning shown beneath it.
- Open “How it was calculated” to see the formula with your values substituted.
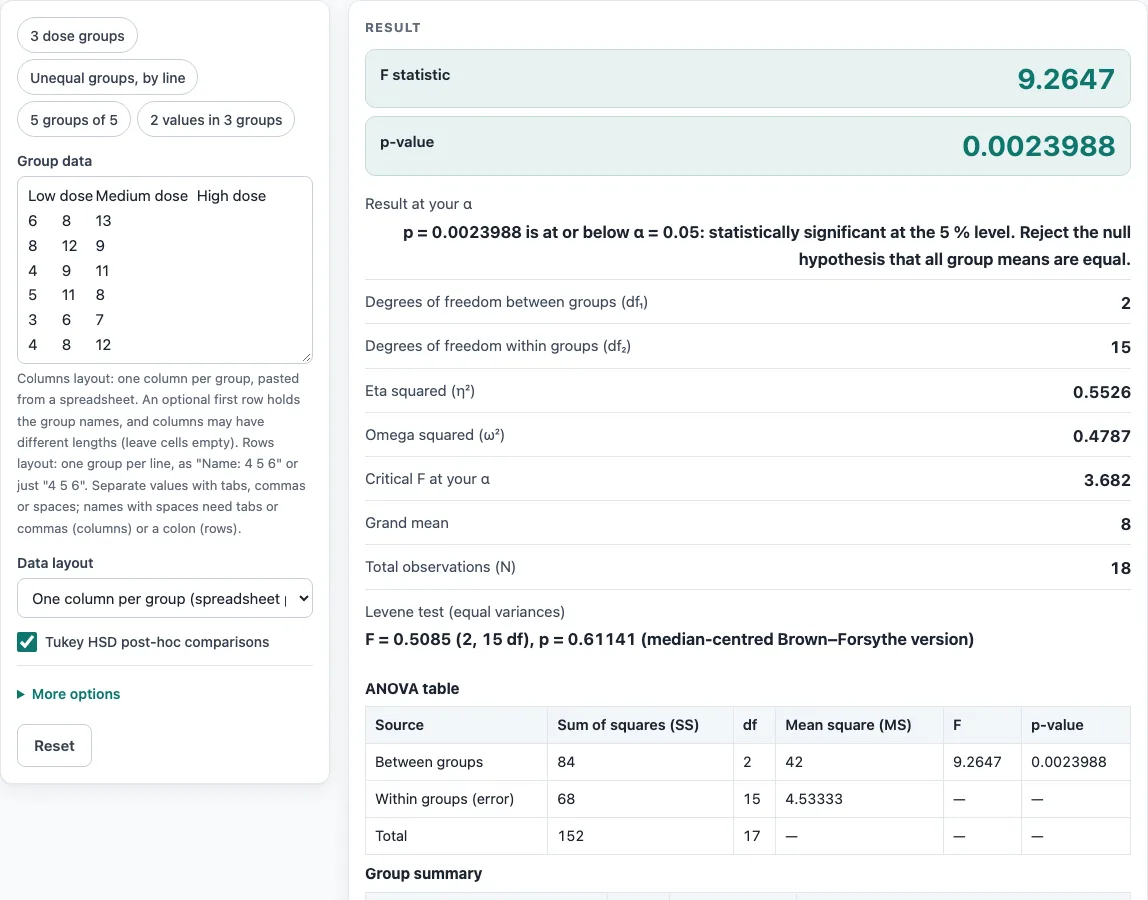
The preset buttons above the form load typical cases: three dose groups of 6, three wards entered one per line with unequal sizes, five groups of 5, and a tiny case with 2 values in 3 groups. Reset restores the starting example.
What is an ANOVA test in statistics (analysis of variance)?
ANOVA stands for analysis of variance. It tests whether the means of several groups are all equal by comparing how far the group means spread apart with how much the values scatter inside each group. “One-way” means the groups differ on one factor, such as a dose level or a hospital ward.
The method splits total variation into two parts. The between-group sum of squares (SSB) measures how far each group mean sits from the grand mean. The within-group sum of squares (SSW) measures how far individual values sit from their own group mean. The null hypothesis says all group means are equal. If the between-group part is large compared with the within-group part, the p-value is small.
Take the worked default: three dose groups with means 5, 9 and 10 give SSB = 84 and SSW = 68. The result is F(2, 15) = 9.2647, p = 0.0023988, which is significant at alpha 0.05.
ANOVA assumes independent observations, roughly normal values in each group and equal variances. The Levene test checks the equal-variance assumption. The calculator shows a warning when its p-value is at or below alpha, because the ordinary F test may then be unreliable and Welch’s ANOVA may be a better choice. Eta squared (SSB / SST) and omega squared give the share of variation explained by group membership. Omega squared corrects for sample size and is set to 0 when it would be negative.
What is the F statistic (and the F test)?
The F statistic is the ratio of the between-group mean square to the within-group mean square. The between-group mean square is SSB divided by (k − 1), where k is the number of groups. The within-group mean square is SSW divided by (N − k), where N is the total number of values. In the worked default, MSB = 84 / 2 = 42 and MSW = 68 / 15 = 4.53, so F = 42 / 4.53 = 9.2647.
A large F means the groups differ more than the scatter inside them would predict. The p-value is the chance of an F this large or larger if all group means were equal. The F test also needs both degrees of freedom: (k − 1) and (N − k). The critical F at your alpha is the cut-off that the calculator compares against.
A significant F only says that at least one mean differs. The Tukey HSD table shows which pairs differ. In the default example, Low vs High (difference 5, p = 0.0027) and Low vs Medium (difference 4, p = 0.0139) differ at 0.05, while Medium vs High (difference 1, p = 0.70) does not.
Worked examples
| Input | Result |
|---|---|
| 3 groups, N = 18 | F(2, 15) = 9.265, p = 0.0023988, significant at α = 0.05 |
| 3 groups, N = 15 | F(2, 12) = 45.07, p = 2.6293 × 10⁻⁶, significant at α = 0.05 |
| 5 groups, N = 25 | F(4, 20) = 9.573, p = 1.7115 × 10⁻⁴, significant at α = 0.05 |
| 3 groups, N = 6 | F(2, 3) = 16, p = 0.025095, significant at α = 0.05 |
Calculated by the tool above with these values.
Frequently asked questions
What does ANOVA stand for?
ANOVA stands for analysis of variance. The name reflects the method: it compares variances to test whether group means differ.
What is ANOVA used for?
ANOVA is used to test whether the mean of a measured value differs between two or more groups. Examples include comparing test scores across teaching methods or yields across fertiliser types. For choosing a test, see Which statistical test to use.
What is one-way ANOVA?
One-way ANOVA compares group means when the groups differ on a single factor. If your data have two factors, such as dose and time, use the two-way ANOVA calculator instead.
Is the calculator free, and is anything I type uploaded?
The calculator is free and needs no account or sign-up. Everything is calculated in your browser, so nothing you type is uploaded.
Can I print or share a calculation?
Yes. “Copy result” copies the result lines with a link. “Copy link” copies the page address, which stores every input, so the same calculation reopens later or can be sent to a colleague. “Print / save as PDF” produces a one-page record with the inputs, results, calculation steps and the date.
Can I use the results in a report?
Results may be used in any work, including commercial reports, theses and client projects, without attribution. Check that the method’s assumptions fit your data before you report them.
Related tools
- Chi-square test calculator: use it to test whether two categorical variables are associated.
- Chi-square goodness of fit calculator: use it to check whether observed category counts match an expected distribution.
- Two-way ANOVA calculator: use it when your data are grouped by two factors.
- Odds ratio calculator: use it to compare the odds of an outcome between two groups in a 2×2 table.
- P-value calculator: use it to convert a test statistic into a p-value.
- Critical value calculator: use it to find the cut-off value for a chosen alpha.
- Which statistical test to use: use it when you are not sure which test fits your question and data.